PyTorch model on cuda() but GPU isn't used!

Hello All;

Here is my issue. I’m running PyTorch model on AWS Studio from Sagemaker.

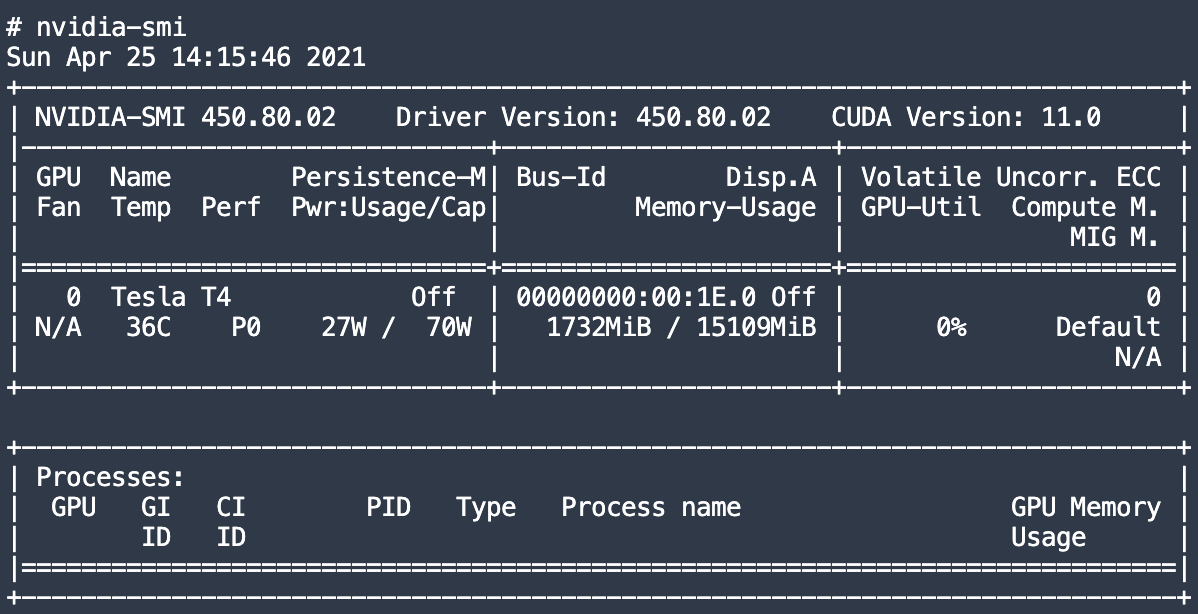
I manage to sent my tensord and my model and my criterion to cuda(). But GPU seems not to be used., and I don’t know why. I’m running the model in an instance with GPU Tesla 4, which isn’t used as seen in the following snapshot:

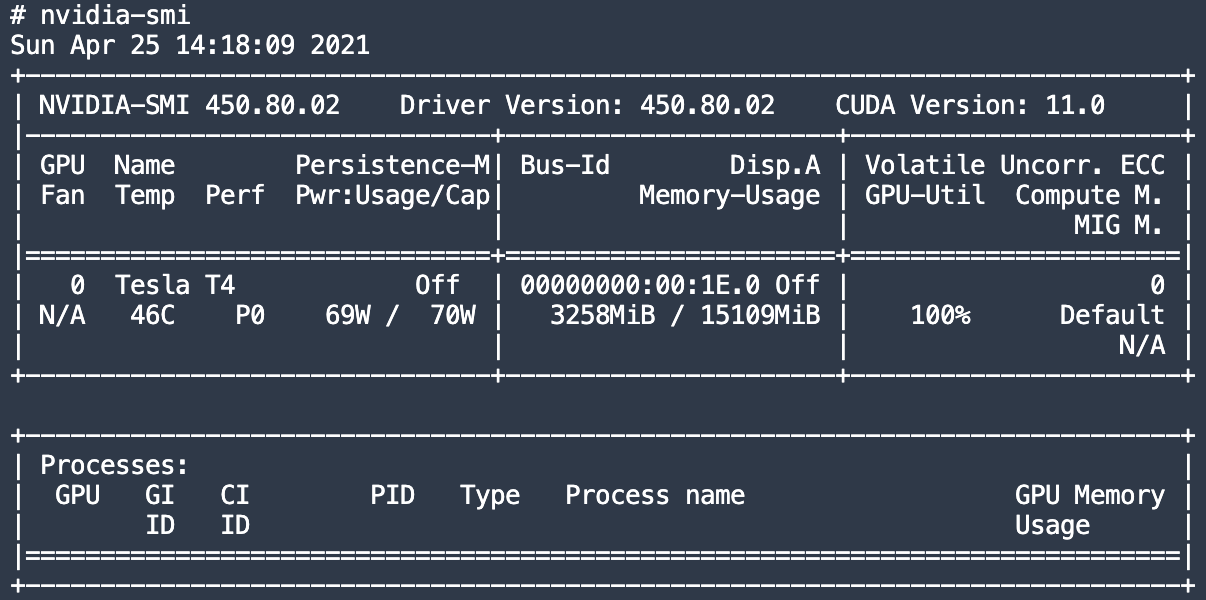
But when I run this code, and I add manually tensors to cuda, with ponctual operations, I can see GPU being consumed:

import torch
a = torch.rand(20000,20000).cuda()
while True:
    a += 1
    a -= 1
    print("Allocated:", round(torch.cuda.memory_allocated(0)/1024**3,1), "GB")

Which is appearing also in nvidia-smi command:

here’s my model:

class Clf(nn.Module):
    def __init__(self, params):
        super(Clf, self).__init__()
            # Input: N x channels_img x 256 x 256
        
        self.pretrained = params['Pretrained']
        C_in, C_out, H_in, W_in = params['Input']
        

        self.conv1 = nn.Conv2d(C_in, C_out, kernel_size=3)
        self.relu = nn.LeakyReLU(0.2)
        self.pool = nn.MaxPool2d(2,2)
        h,w,_ = findConv2dOutShape(H_in,W_in,self.conv1,pool=2)
        
        self.conv2 = nn.Conv2d(C_out, C_out * 2, 3)
        h,w,_ = findConv2dOutShape(h,w,self.conv2,pool=2)
        
        self.conv3 = nn.Conv2d(C_out * 2, C_out * 4, 3)
        h,w,c = findConv2dOutShape(h,w,self.conv3,pool=2)
        
        #self.conv4 = nn.Conv2d(C_out * 4, C_out * 8, 3)
        #h,w = findConv2dOutShape(h,w,self.conv4,pool=2)
        
        #self.reshape = Reshape() # => (64, -1)

        self.num_flatten = h*w*c
        self.fc1 = nn.Linear(self.num_flatten, 512)
        self.fc2 = nn.Linear(512, 1)

    def forward(self, x):
        if self.pretrained is None:
            x = self.relu(self.conv1(x))
            x = self.pool(x)
            x = self.relu(self.conv2(x))
            x = self.pool(x)
            x = self.relu(self.conv3(x))
            x = self.pool(x)
            #x = self.relu(self.conv4(x))
            #x = self.pool(x)
            x = x.view(-1, self.num_flatten)
            x = self.fc1(x)
            x = self.fc2(x)
            return torch.sigmoid(x)

And here’s my training loop

def train_model(model, criterion, optimizer, loader, test_loader, num_epoch):

    for epoch in range(num_epoch):
        print(f'Epoch -- {epoch}')
        train_one_epoch(model, loader, optimizer, criterion)

def train_one_epoch(model, loader, optimizer, criterion):
    losses = []
    longueur_data = 0
    for batch_idx, (x, y) in enumerate(loader):
        
        print(f'Batch num -- {batch_idx}')
        
        x = x.cuda()
        y = y.to(torch.float32).unsqueeze(1).cuda()
        
        optimizer.zero_grad()
        
        scores= model(x)
        
        loss = criterion(scores, y)
        loss.backward()
        optimizer.step()
        
        print("Allocated:", round(torch.cuda.memory_allocated(0)/1024**3,1), "GB")
        
        losses.append(loss.item())
        longueur_data += x.size(0)

    Loss = sum(losses) / longueur_data
    print(f'Loss Epoch : {Loss}')

Please help, this is driving crazy since two weeks.

Thank you very much
Habib

If the code isn’t raising an error and you’ve pushed the data as well as the model to the GPU, it’ll be used.
You might face another bottleneck, so that the GPU utilization is low and you would mostly see a 0% util. in nvidia-smi.
To check for a data loading bottleneck, you could remove the data loading and use random tensors created on the GPU, which should show a higher GPU util.

Thank you very much for your reply.
Yes that’s the case, I’m sending everything to cuda(), but nvidia-smi gives almost 0% GPU utilisation.
I’m struggling with this since two weeks, I can’t figure out what’s wrong.

Here is my DataLoader Class: (I’m loading data from S3 Bucket into memory via this Class)

class myDataset(Dataset):
    def __init__(self, csv_file, root_dir, target, length, transform=None):
        self.annotations = pd.read_csv(fs.open(csv_file)).iloc[:length,:]
        self.root_dir = root_dir
        self.transform = transform
        self.target = target
        self.length = length

    def __len__(self):
        return len(self.annotations)

    def __getitem__(self, index):
        img_path = fs.open(os.path.join(self.root_dir, self.annotations.loc[index, 'image_id']))
        image = Image.open(img_path)
        image = np.array(image)

        if self.transform:
            image = self.transform(image=image)["image"]

        image = np.transpose(image, (2, 0, 1)).astype(np.float32)
        image = torch.Tensor(image)
        y_label = torch.tensor(int(self.annotations.loc[index, str(self.target)]))
        return image, y_label

And my training loop:

def train_model(model, criterion, optimizer, loader, test_loader, num_epoch):

    for epoch in tqdm(range(num_epoch)):
        #print(f'Epoch -- {epoch}')
        train_one_epoch(model, loader, optimizer, criterion)

def train_one_epoch(model, loader, optimizer, criterion):
    losses = []
    longueur_data = 0
    for batch_idx, (x, y) in enumerate(tqdm(loader)):
        
        x = x.to('cuda')
        y = y.to(torch.float32).unsqueeze(1).to('cuda')
        
        optimizer.zero_grad()
        
        scores= model(x)
        
        loss = criterion(scores, y)
        loss.backward()
        optimizer.step()
        
        losses.append(loss.item())
        longueur_data += x.size(0)

    Loss = sum(losses) / longueur_data
    print(f'Loss Epoch : {Loss}')

Here is the call to my Dataset Class, and my data loading (I’m using albumentations for data augmentation):

aug = al.Compose([
    al.RandomResizedCrop(H, W, p=0.2),
    al.Resize(H, W),
    al.Transpose(p=0.2),
    al.HorizontalFlip(p=0.5),
    al.VerticalFlip(p=0.2),
    al.augmentations.transforms.Normalize(mean=[0.485, 0.456, 0.406], 
                                          std=[0.229, 0.224, 0.225], 
                                          max_pixel_value=255.0, 
                                          always_apply=True, 
                                          p=1.0)
])


dataset = myDataset(csv_file=LABEL_PATH,
                    root_dir=IMAGE_PATH,
                    target='gender',
                    length=LENGTH,
                    transform=aug)

train_set, test_set = torch.utils.data.random_split(dataset,[int(LENGTH*0.8), LENGTH - int(LENGTH*0.8)])


train_loader = DataLoader(dataset=train_set, batch_size=batch_size, shuffle=True)
test_loader = DataLoader(dataset=test_set, batch_size=batch_size, shuffle=True)

I cannot figure out where is the issue.
Thank you very much,

Did you try to remove the data loading and check the GPU utilization using random tensors created on the GPU as described before? This could narrow down the bottleneck of your code and make it easier to isolate it.
Also, you could profile your code as described in this post using Nsight Systems or the PyTorch profiler.

Thank you @ptrblck for your response, yes I did as shown in the first post.

When I run this code, and I add manually tensors to cuda, with ponctual operations, I can see GPU being consumed:

import torch
a = torch.rand(20000,20000).cuda()
while True:
    a += 1
    a -= 1
    print("Allocated:", round(torch.cuda.memory_allocated(0)/1024**3,1), "GB")

It raises the % of utilisation of GPU from 1.7GB to 3.2GB, as shown in the nvidia-smi command results, please see the nvidia-smi screenshots of my first post.

I’ll try with the packages you listed, thank you.
What might be the solutions to solve this GPU Bottleneck ? I can try them all.

Thank you very much

You would first have to isolate the bottleneck before a solution can be found.
E.g. if the data loading is the bottleneck, you would need to speed it up by e.g. using multiple workers, speeding up the transformations etc.

The utilization shows a percentage of the time the GPU was busy in a specific last time frame, not the memory usage.

Thank you @ptrblck.
As I’m working on aws services, I found that when I moved all my dataset to my EC2 instance, where I have my PyTorch/Cuda optimized notebooks, the GPU started to be used, which speeded it up.
Though, the usage of the GPU is still low, and doesn’t reach 80% unless I input big load of images, and big batch_size.
Hence, I presume the data loading being the origin of my issues.
I’ll test pinning memory, using multiple workers, and let you know.

Thank you very much
Habib

Just to confirm this solution. For training Deeplearning in AWS, must have your data locally, either locally in EC2 instance, either locally in EC2 of Notebook of Sagemaker.

And last information, pin_memory and num_worker, make the training faster ! much faster !

Thank you
Habib