I am trying to replicate the model parallel best practices tutorial.
I use Tesla K80 GPUs for running the example. I didn’t plot graphs but I have the following stats.
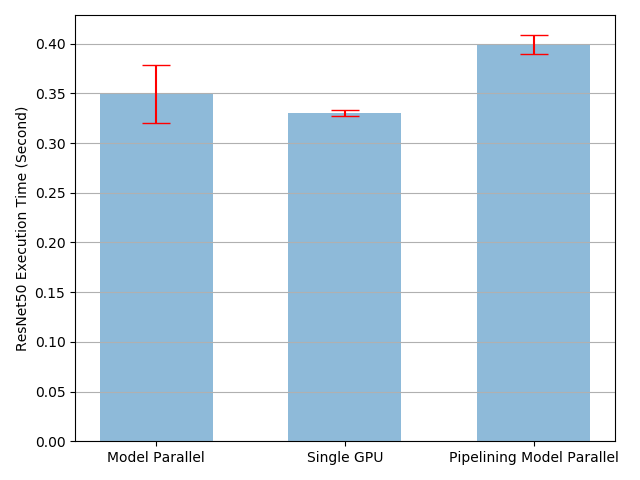
Single Node Time: 2.1659805027768018
Model Parallel Time: 2.23040875303559
Pipeline 20 Mean: 3.496733816713095
I don’t get the best results at this split size and it could be okay, depending on the hardware, software issues this can be possible. So I went for testing what is going on. Then I ran the rest of the tutorial for different split sizes. These are the results I obtain for the given split sizes.
Here is the graph I obtained,
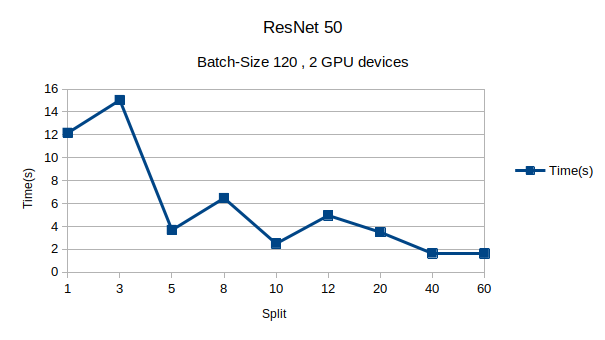
Stats for corresponding split sizes
[11.667116858577355, 15.080700974399225, 3.556491438532248, 6.485900523653254, 2.4750063681043684, 4.956193731771782, 3.506740797869861, 1.6466765413060784, 1.5998394633177668]
I don’t get a similar graph. Instead of having a local minima in the middle, I get the minimum value for split size 60.
Then I investigated bit deeper by just logging the times for Forward prop, backward prop, label copy time and optimization time.
I get something like this,
MBi refers to i^th mini-batch
FW : forward time
BW: backward time
LBL_CP: label copy time
OPT : optimization time
For split size 20
MB-1: FW 0.12454676628112793, LBL_CP 0.5665407180786133, BW 0.25083422660827637, OPT 0.015613555908203125
MB-2: FW 0.31687474250793457, LBL_CP 0.5684511661529541, BW 0.26471543312072754, OPT 0.017733335494995117
MB-3: FW 0.3080329895019531, LBL_CP 0.571399450302124, BW 0.2626023292541504, OPT 0.018143177032470703
Split Size 1
MB1: FW 2.2466013431549072, LBL_CP 0.003688812255859375, BW 1.7002854347229004, OPT 0.0038182735443115234
MB2: FW 2.2562222480773926, LBL_CP 0.00019812583923339844, BW 1.6973598003387451, OPT 0.0039861202239990234
MB3: FW 2.2152814865112305, LBL_CP 0.0023992061614990234, BW 1.6881706714630127, OPT 0.004811525344848633
Split Size 3
MB1: FW 3.195209264755249, LBL_CP 0.7909142971038818, BW 0.9772884845733643, OPT 0.0038728713989257812
MB1: FW 3.122593402862549, LBL_CP 0.7815954685211182, BW 0.960608959197998, OPT 0.0037987232208251953
MB1: FW 3.2085180282592773, LBL_CP 0.7906265258789062, BW 0.9696476459503174, OPT 0.003855466842651367
Split Size 5
MB1: FW 0.5092735290527344, LBL_CP 0.003528594970703125, BW 0.6527245044708252, OPT 0.005049228668212891
MB2: FW 0.44788599014282227, LBL_CP 0.0061757564544677734, BW 0.6450486183166504, OPT 0.003782510757446289
MB3: FW 0.514885425567627, LBL_CP 0.003251314163208008, BW 0.6562778949737549, OPT 0.004816293716430664
The label copy time fluctuates a lot, but It always copy the same size of array chunk, isn’ it?
In addition the FW time also fluctuates in an unexpected way. I am trying to profile this and see what happens.
But, I would like to get an insight, why this could be happening?
(Does this has something to do with NVLink?)