Problem
I am trying to understand how the torch.cuda.synchronize works hands on, with the ultimate goal of profiling the CUDA processes on the Jetson Orin Nano (Jetpack 6.2.1).
As what I thought would be a simple example, I tried to add two tensors (a and b) together (to make c). With a size ranging from (100, 100) up to (20000, 20000). Once with, and another time without torch.cuda.synchronize() enabled.
What works:
![]() Enabling CUDA
Enabling CUDA
![]() Printing wall time for
Printing wall time for torch.cuda.synchronize() enabled and disabled
![]() Tensor size from
Tensor size from (100, 100) up to (10000, 10000)
What doesn’t work:
![]() Tensor size of
Tensor size of (20000, 20000) → Out of memory
How can I figure out what the problem is?
Debugging attempt
This is a minimal script, that replicates the problem that I have.
import torch
import time
import sys

from torch.profiler import profile, ProfilerActivity
PROFILER_AVAILABLE = True

# Ensure CUDA is available
if not torch.cuda.is_available():
    print("CUDA is not available.")
    exit()


sizes = [
    (100, 100),
    (500, 500),
    (1000, 1000),
    (2000, 2000),
    (5000, 5000),
    (10000, 10000),
    (20000, 20000),# crashes

]

print(f"{'Size':>12} | {'No Sync (s)':>12} | {'Sync (s)':>12}")
print("-" * 42)
for shape in sizes:
    a = torch.randn(*shape, device='cuda')
    b = torch.randn(*shape, device='cuda')

    # Time without synchronization
    start_no_sync = time.time()
    c = a + b
    end_no_sync = time.time()
    no_sync_time = end_no_sync - start_no_sync

    # Time with synchronization
    start_sync = time.time()
    c = a + b
    torch.cuda.synchronize()
    end_sync = time.time()
    sync_time = end_sync - start_sync

    del a, b, c  # Free memory

    print(f"{str(shape):>12} | {no_sync_time:12.6f} | {sync_time:12.6f}")
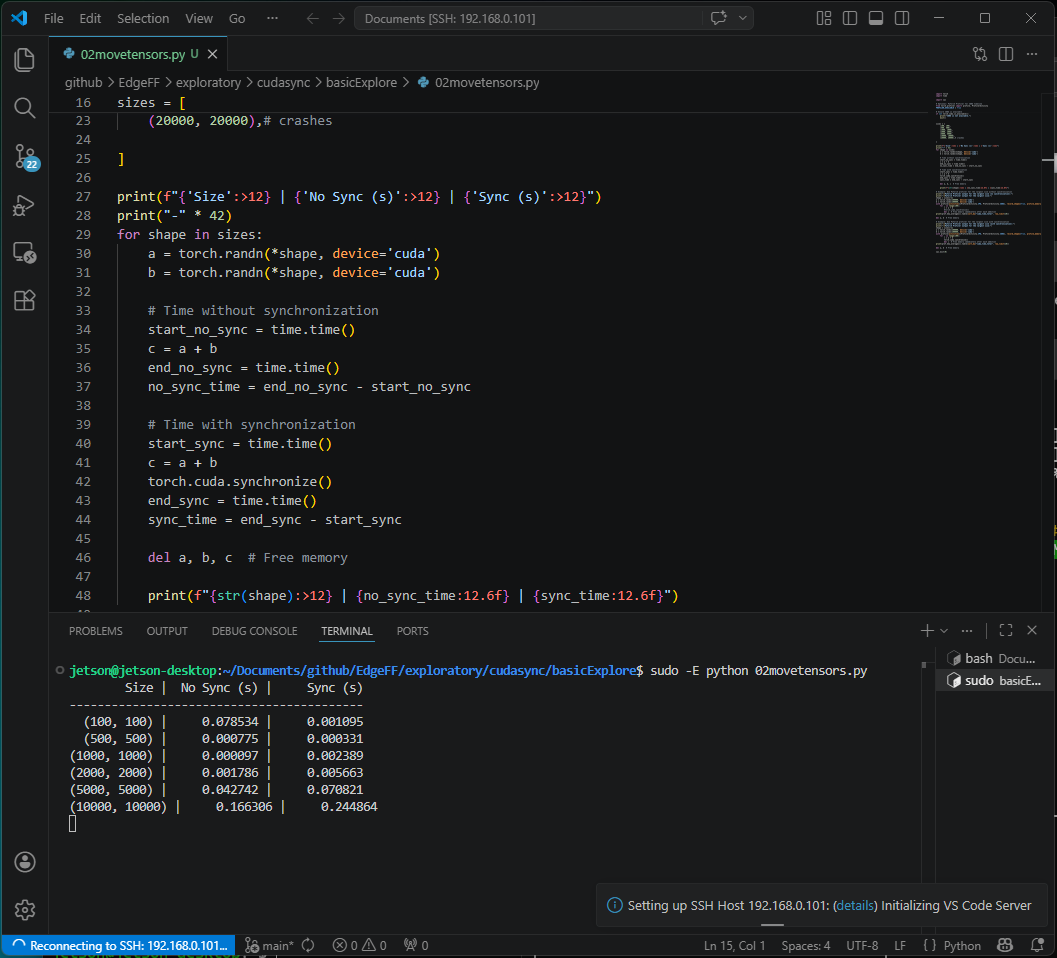
Output
jetson@jetson-desktop:~/Documents/github/EdgeFF/exploratory/cudasync/basicExplore$ sudo -E python 02movetensors.py
        Size |  No Sync (s) |     Sync (s)
------------------------------------------
  (100, 100) |     0.078534 |     0.001095
  (500, 500) |     0.000775 |     0.000331
(1000, 1000) |     0.000097 |     0.002389
(2000, 2000) |     0.001786 |     0.005663
(5000, 5000) |     0.042742 |     0.070821
(10000, 10000) |     0.166306 |     0.244864
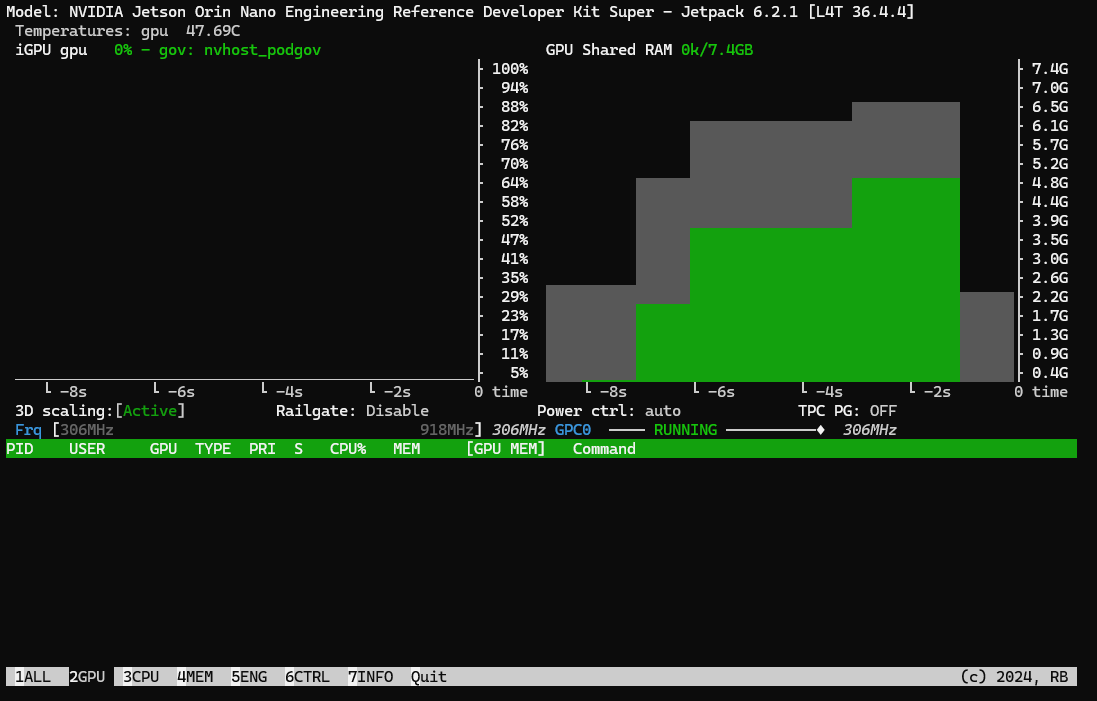
Notice that all the tensor sizes from (100, 100) up to (10000, 10000) are printed. I can confirm that we have an OOM incident occurring, by observing the jtop window. This is the last frame of jtop that is sent over SSH prior to the Jetson Orin Nano crashing. Note that I am using SSH, with the GUI disabled (sudo init 3) such that there is minimal overhead for competing GPU compute/memory.
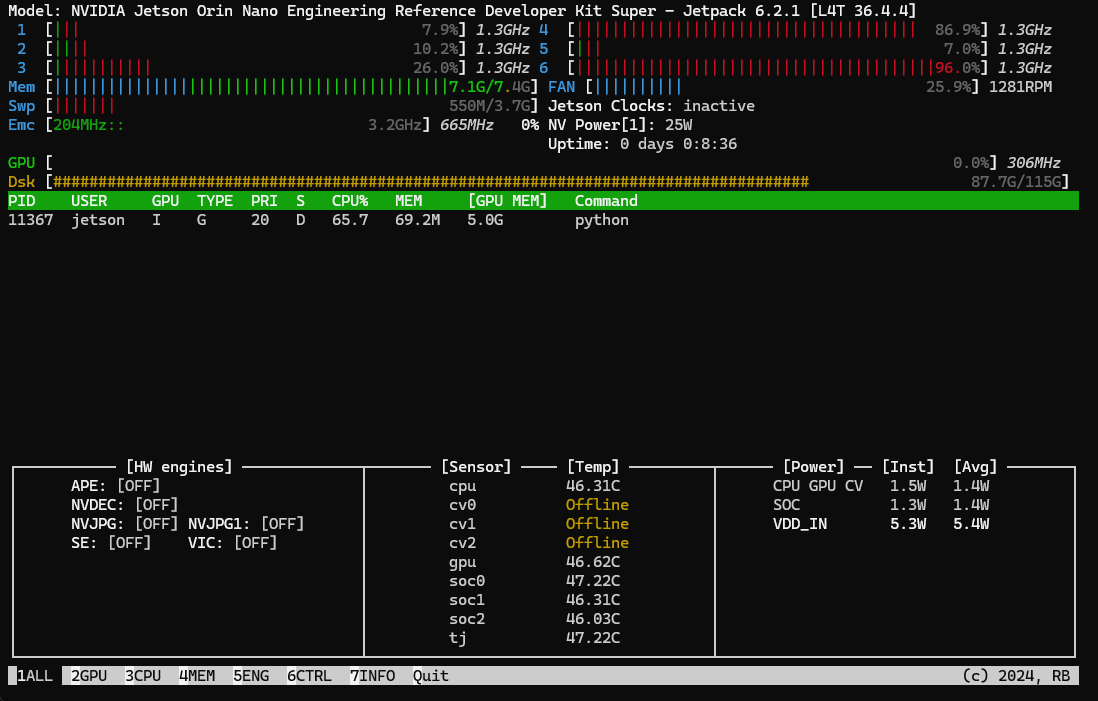
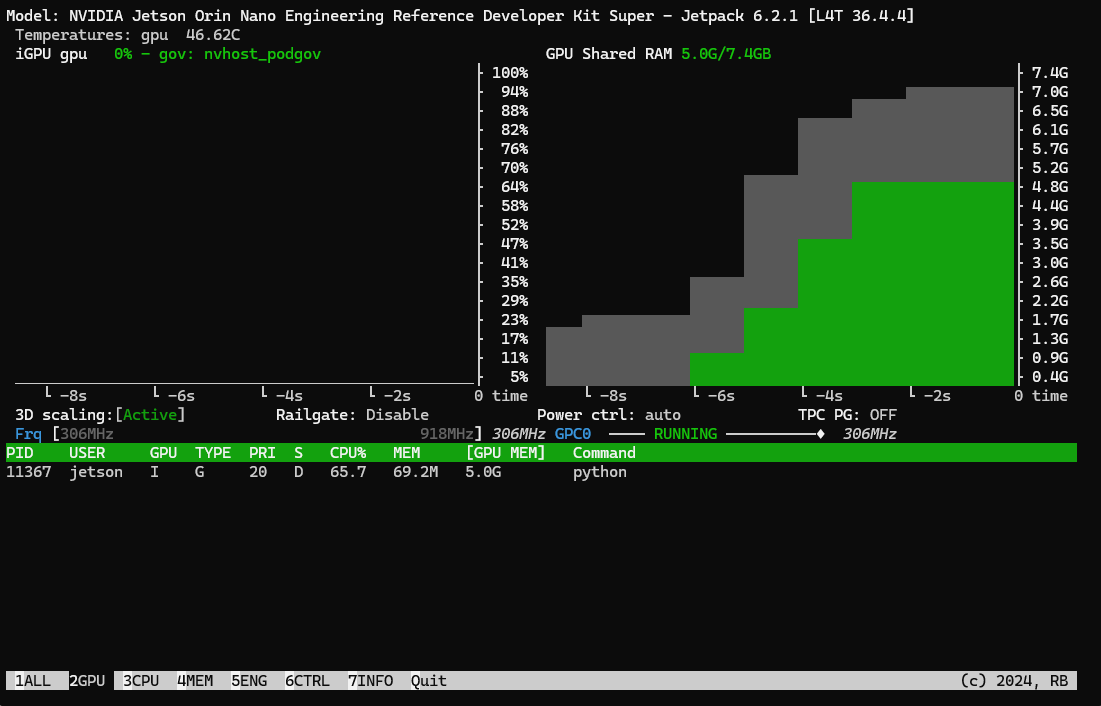
The total memory rises to 7.1GB (out of shared 7.4GB CPU/GPU total), with 5.0GB of the GPU memory taken over by the python thread.
Now, this is the interesting part. I tried to profile to better understand what is happening to the memory. Hence, I attempted to just profile the largest size, that would have a Python GPU memory footprint of under 5.0GB with the additional section below.
custom_sizes = (16000, 16000)

# Example: Use PyTorch profiler for the largest size without synchronization
print("\nPyTorch Profiler output for the largest size (no synchronization):")
print("\nPyTorch Profiler output for the largest size:")
a = torch.randn(custom_sizes, device='cuda')
b = torch.randn(custom_sizes, device='cuda')
with profile(activities=[ProfilerActivity.CPU, ProfilerActivity.CUDA],record_shapes=True, profile_memory=True) as prof:
    for _ in range(1):
        c = a + b
        #torch.cuda.synchronize()
        del c  # Free memory immediately after each addition
print(prof.key_averages().table(sort_by="cuda_time_total", row_limit=10))

del a, b  # Free memory

# Example: Use PyTorch profiler for the largest size with synchronization
print("\nPyTorch Profiler output for the largest size (with synchronization):")
print("\nPyTorch Profiler output for the largest size:")
shape = sizes[-1]
a = torch.randn(custom_sizes, device='cuda')
b = torch.randn(custom_sizes, device='cuda')
with profile(activities=[ProfilerActivity.CPU, ProfilerActivity.CUDA], record_shapes=True, profile_memory=True) as prof:
    for _ in range(1):
        c = a + b
        torch.cuda.synchronize()
        del c  # Free memory immediately after each addition
print(prof.key_averages().table(sort_by="cuda_time_total", row_limit=10))

del a, b  # Free memory

sys.exit(0)
A size of (16000, 16000) leads to 4.9GB of GPU Ram being used by Python.
jetson@jetson-desktop:~/Documents/github/EdgeFF/exploratory/cudasync/basicExplore$ sudo -E python 02movetensors.py
        Size |  No Sync (s) |     Sync (s)
------------------------------------------
  (100, 100) |     0.019701 |     0.000792
  (500, 500) |     0.000501 |     0.000534
(1000, 1000) |     0.000095 |     0.002402
(2000, 2000) |     0.001236 |     0.005430
(5000, 5000) |     0.044867 |     0.073148
(10000, 10000) |     0.164679 |     0.233903

PyTorch Profiler output for the largest size (no synchronization):

PyTorch Profiler output for the largest size:
-------------------------------------------------------  ------------  ------------  ------------  ------------  ------------  ------------  ------------  ------------  ------------  ------------  ------------  ------------  ------------  ------------
                                                   Name    Self CPU %      Self CPU   CPU total %     CPU total  CPU time avg     Self CUDA   Self CUDA %    CUDA total  CUDA time avg       CPU Mem  Self CPU Mem      CUDA Mem  Self CUDA Mem    # of Calls
-------------------------------------------------------  ------------  ------------  ------------  ------------  ------------  ------------  ------------  ------------  ------------  ------------  ------------  ------------  ------------  ------------
                                              aten::add         0.15%     550.612us        77.44%     276.848ms     276.848ms      80.485ms       100.00%     160.971ms     160.971ms           0 B           0 B     976.56 MB     976.56 MB             1
                                           Unrecognized         0.55%       1.957ms         0.55%       1.957ms       1.957ms      80.485ms       100.00%      80.485ms      80.485ms           0 B           0 B           0 B           0 B             1
void at::native::vectorized_elementwise_kernel<4, at...         0.00%       0.000us         0.00%       0.000us       0.000us      80.485ms       100.00%      80.485ms      80.485ms           0 B           0 B           0 B           0 B             1
                                  cudaStreamIsCapturing         0.01%      27.012us         0.01%      27.012us      27.012us       0.000us         0.00%       0.000us       0.000us           0 B           0 B           0 B           0 B             1
                                             cudaMalloc        76.67%     274.096ms        76.67%     274.096ms     274.096ms       0.000us         0.00%       0.000us       0.000us           0 B           0 B           0 B           0 B             1
                                       cudaLaunchKernel         0.06%     217.057us         0.06%     217.057us     217.057us       0.000us         0.00%       0.000us       0.000us           0 B           0 B           0 B           0 B             1
                                               [memory]         0.00%       0.000us         0.00%       0.000us       0.000us       0.000us         0.00%       0.000us       0.000us           0 B           0 B    -976.56 MB    -976.56 MB             1
                                  cudaDeviceSynchronize        22.56%      80.631ms        22.56%      80.631ms      80.631ms       0.000us         0.00%       0.000us       0.000us           0 B           0 B           0 B           0 B             1
-------------------------------------------------------  ------------  ------------  ------------  ------------  ------------  ------------  ------------  ------------  ------------  ------------  ------------  ------------  ------------  ------------
Self CPU time total: 357.479ms
Self CUDA time total: 80.485ms


PyTorch Profiler output for the largest size (with synchronization):

PyTorch Profiler output for the largest size:
-------------------------------------------------------  ------------  ------------  ------------  ------------  ------------  ------------  ------------  ------------  ------------  ------------  ------------  ------------  ------------  ------------
                                                   Name    Self CPU %      Self CPU   CPU total %     CPU total  CPU time avg     Self CUDA   Self CUDA %    CUDA total  CUDA time avg       CPU Mem  Self CPU Mem      CUDA Mem  Self CUDA Mem    # of Calls
-------------------------------------------------------  ------------  ------------  ------------  ------------  ------------  ------------  ------------  ------------  ------------  ------------  ------------  ------------  ------------  ------------
                                              aten::add         0.17%     231.493us         1.56%       2.115ms       2.115ms      48.063ms       100.00%      96.126ms      96.126ms           0 B           0 B     976.56 MB     976.56 MB             1
                                           Unrecognized         1.31%       1.782ms         1.31%       1.782ms       1.782ms      48.063ms       100.00%      48.063ms      48.063ms           0 B           0 B           0 B           0 B             1
void at::native::vectorized_elementwise_kernel<4, at...         0.00%       0.000us         0.00%       0.000us       0.000us      48.063ms       100.00%      48.063ms      48.063ms           0 B           0 B           0 B           0 B             1
                                       cudaLaunchKernel         0.07%     100.911us         0.07%     100.911us     100.911us       0.000us         0.00%       0.000us       0.000us           0 B           0 B           0 B           0 B             1
                                  cudaDeviceSynchronize        98.44%     133.741ms        98.44%     133.741ms      66.870ms       0.000us         0.00%       0.000us       0.000us           0 B           0 B           0 B           0 B             2
                                               [memory]         0.00%       0.000us         0.00%       0.000us       0.000us       0.000us         0.00%       0.000us       0.000us           0 B           0 B    -976.56 MB    -976.56 MB             1
-------------------------------------------------------  ------------  ------------  ------------  ------------  ------------  ------------  ------------  ------------  ------------  ------------  ------------  ------------  ------------  ------------
Self CPU time total: 135.856ms
Self CUDA time total: 48.063ms
This creates two additional questions:
- The profiler puts the memory usage at
976.56 MBwhich is clearly not4.9GBreport injtop. What is the cause of this discrepancy? - Even though
torch.cuda.synchronizeis not active,cudaDeviceSynchronizeis part of the function call in the PyTorch profiler. I’ve read through the relavent section in the documentation, and cannot figure out what I am missing for accurate memory profiling?
System specifications:
- Jetson Orin Nano with Ubuntu 22.04 (aarch64) and Jetpack 6.2.1
- CUDA 12.6.68
- PyTorch 2.8.0
Please let me know if I can provide additional information! Thanks in advance ![]()