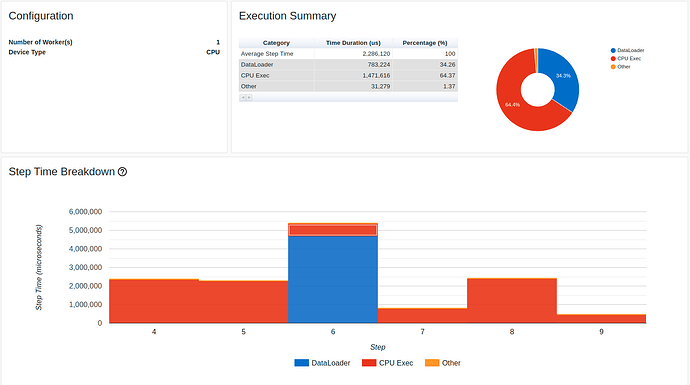
I’ve been using PyTorch profiler and the results are attached here. The chart only shows DataLoader, CPU Exec and Other. Tensorboard chart is not showing GPU time. I’ve used activities=[torch.profiler.ProfilerActivity.CUDA, torch.profiler.ProfilerActivity.CPU], in profiling code and the GPU is being utilized as well. How can this be fixed so that GPU timings are also shown?
Hi!
I have the same issue. Did you find a solution? Are you also on Windows and using PyTorch 1.11?
Printing the results in the console works however.
print(prof.key_averages().table(sort_by=“cuda_time_total”, row_limit=20))
