Hello everyone,
I’m new here, hopefully I write this in the correct way.
I’ve recently gotten to use PyTorch’s profiler but I can’t seem to see any activity on my GPU as far as the profiler is concerned. Currently I’m running the example as seen on this guide. The code runs no problem and compiles. I can see activity on my GPU and the CUDA graph in task manager (showing specifically the CUDA graph, I did my homework) is showing activity when I run the code so it clearly is not PyTorch nor CUDA my problem.
Here is the code I use to create the model and start the profiler:
def main():
    transform = T.Compose(
        [T.Resize(224),
         T.ToTensor(),
         T.Normalize((0.5, 0.5, 0.5), (0.5, 0.5, 0.5))])
    train_set = torchvision.datasets.CIFAR10(root='./data', train=True, download=True, transform=transform)
    train_loader = torch.utils.data.DataLoader(train_set, batch_size=32, shuffle=True, num_workers=4)

    device = torch.device("cuda:0")
    model = torchvision.models.resnet18(pretrained=True).to(device)
    criterion = torch.nn.CrossEntropyLoss().to(device)
    optimizer = torch.optim.SGD(model.parameters(), lr=0.001, momentum=0.9)
    model.train()

    def train(data):
        inputs, labels = data[0].to(device), data[1].to(device)
        outputs = model(inputs)
        loss = criterion(outputs, labels)
        optimizer.zero_grad()
        loss.backward()
        optimizer.step()

    with torch.profiler.profile(
            schedule=torch.profiler.schedule(wait=1, warmup=1, active=3),
            on_trace_ready=torch.profiler.tensorboard_trace_handler('./log/resnet18'),
            record_shapes=True,
            profile_memory=True,
            with_stack=True
    ) as prof:
        for step, batch_data in enumerate(train_loader):
            if step >= 200:  # tried increasing this because maybe it wasn't running long enough?
                break
            train(batch_data)
            prof.step()  # Need to call this at the end of each step to notify profiler of steps' boundary.


if __name__ == '__main__':
    main()
And yet when I open TensorBoard at the appropriate location I see only this:
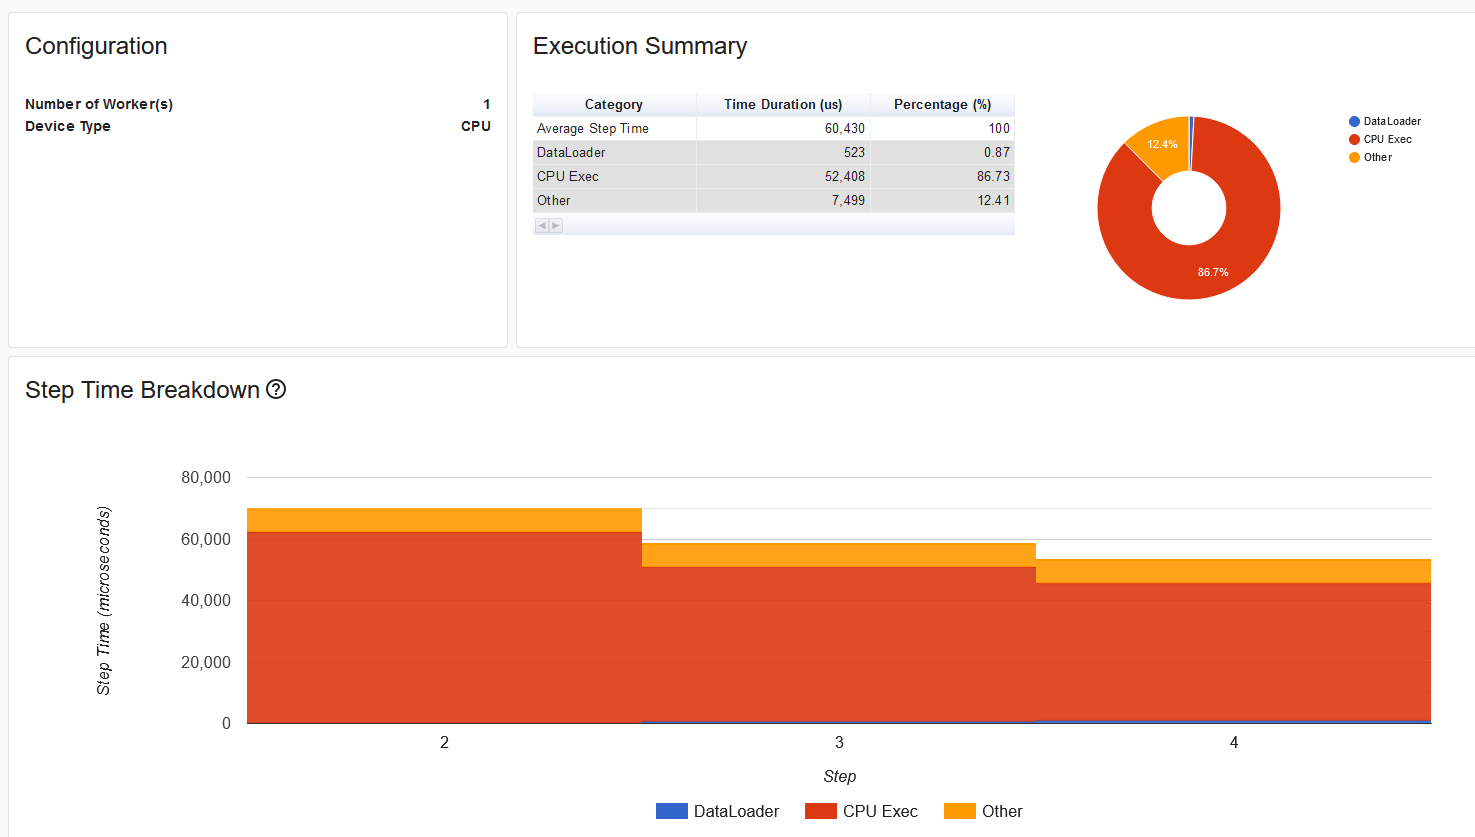
And the GPU Kernel element is completely missing from the side bar as well.
I don’t understand what I am doing wrong in this case. Is this just a Windows problem or am I using the profiler incorrectly?
Thank you for your help!
ChowderII