Anders_V
May 4, 2023, 11:08am
1
Hi, I’m trying to get started with the Pytorch profiler and noticed that in all of my runs on different models/tutorial codes the Pytorch tensorboard always displays step number 0? I’m confused if this means that it only did one loop of sampling or if there is some Tensorboard setting I need to hit? Honestly I’m very confused about if the Profiler is behaving as expected
Finally I copied the code from this tutorial verbatim:https://pytorch.org/tutorials/intermediate/tensorboard_profiler_tutorial.html
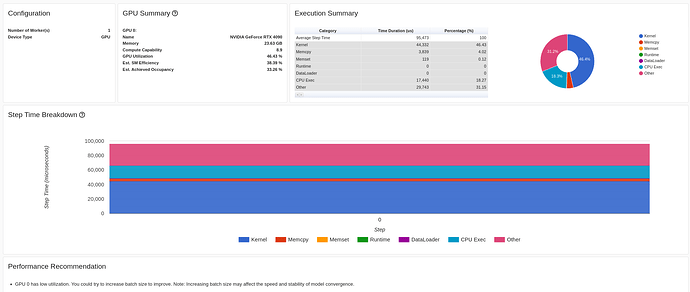
and the end result looks like this on my tensorboard
It is different from the tutorial which had four steps. (Should be noted I’m running tensorboard from VS code, not a chrome instance like the tutorial)
Brasilino
May 4, 2023, 7:12pm
2
Hello @Anders_V
Please double-check the prof.step() indentation. Make sure it is within the for loop scope.
Best,
Hi, I reran and double checked the prof.step() indentation, but I’m still having the same issue.
Here is my code for reference.
# https://pytorch.org/tutorials/intermediate/tensorboard_profiler_tutorial.html

import torch
import torch.nn
import torch.optim
import torch.profiler
import torch.utils.data
import torchvision.datasets
import torchvision.models
import torchvision.transforms as T


transform = T.Compose(
    [T.Resize(224),
     T.ToTensor(),
     T.Normalize((0.5, 0.5, 0.5), (0.5, 0.5, 0.5))])
train_set = torchvision.datasets.CIFAR10(root='./data', train=True, download=True, transform=transform)
train_loader = torch.utils.data.DataLoader(train_set, batch_size=32, shuffle=True)

device = torch.device("cuda:0")
model = torchvision.models.resnet18(weights='IMAGENET1K_V1').cuda(device)
criterion = torch.nn.CrossEntropyLoss().cuda(device)
optimizer = torch.optim.SGD(model.parameters(), lr=0.001, momentum=0.9)
model.train()


def train(data):
    inputs, labels = data[0].to(device=device), data[1].to(device=device)
    outputs = model(inputs)
    loss = criterion(outputs, labels)
    optimizer.zero_grad()
    loss.backward()
    optimizer.step()


with torch.profiler.profile(
        schedule=torch.profiler.schedule(wait=1, warmup=1, active=3, repeat=2),
        on_trace_ready=torch.profiler.tensorboard_trace_handler('./log/resnet18'),
        record_shapes=True,
        profile_memory=True,
        with_stack=True
) as prof:
    for step, batch_data in enumerate(train_loader):
        if step >= (1 + 1 + 3) * 2:
            break
        train(batch_data)
        prof.step()
When the code above finished executing I get this in the terminal:
Files already downloaded and verified
STAGE:2023-05-05 10:14:30 5872:5872 ActivityProfilerController.cpp:311] Completed Stage: Warm Up
[W CPUAllocator.cpp:235] Memory block of unknown size was allocated before the profiling started, profiler results will not include the deallocation event
STAGE:2023-05-05 10:14:30 5872:5872 ActivityProfilerController.cpp:317] Completed Stage: Collection
STAGE:2023-05-05 10:14:30 5872:5872 ActivityProfilerController.cpp:321] Completed Stage: Post Processing
STAGE:2023-05-05 10:14:30 5872:5872 ActivityProfilerController.cpp:311] Completed Stage: Warm Up
STAGE:2023-05-05 10:14:30 5872:5872 ActivityProfilerController.cpp:317] Completed Stage: Collection
STAGE:2023-05-05 10:14:30 5872:5872 ActivityProfilerController.cpp:321] Completed Stage: Post Processing
And the result when I start tensorboard is the same as in the original image.
