Hi,
I am trying to use pytorch profiler to profile a RGCN sample code in DGL official git repo that is written in pytorch. Following the link (PyTorch Profiler — PyTorch Tutorials 2.2.0+cu121 documentation), I want to inspect the calling stack by setting with_stack=True. However, it does not give me the calling stack.
I also tried this pytorch official link (PyTorch Profiler With TensorBoard — PyTorch Tutorials 2.2.0+cu121 documentation), I ran exactly the same code (setting with_stack=True). However, the view stack is gray out. I attached the picture to show this.
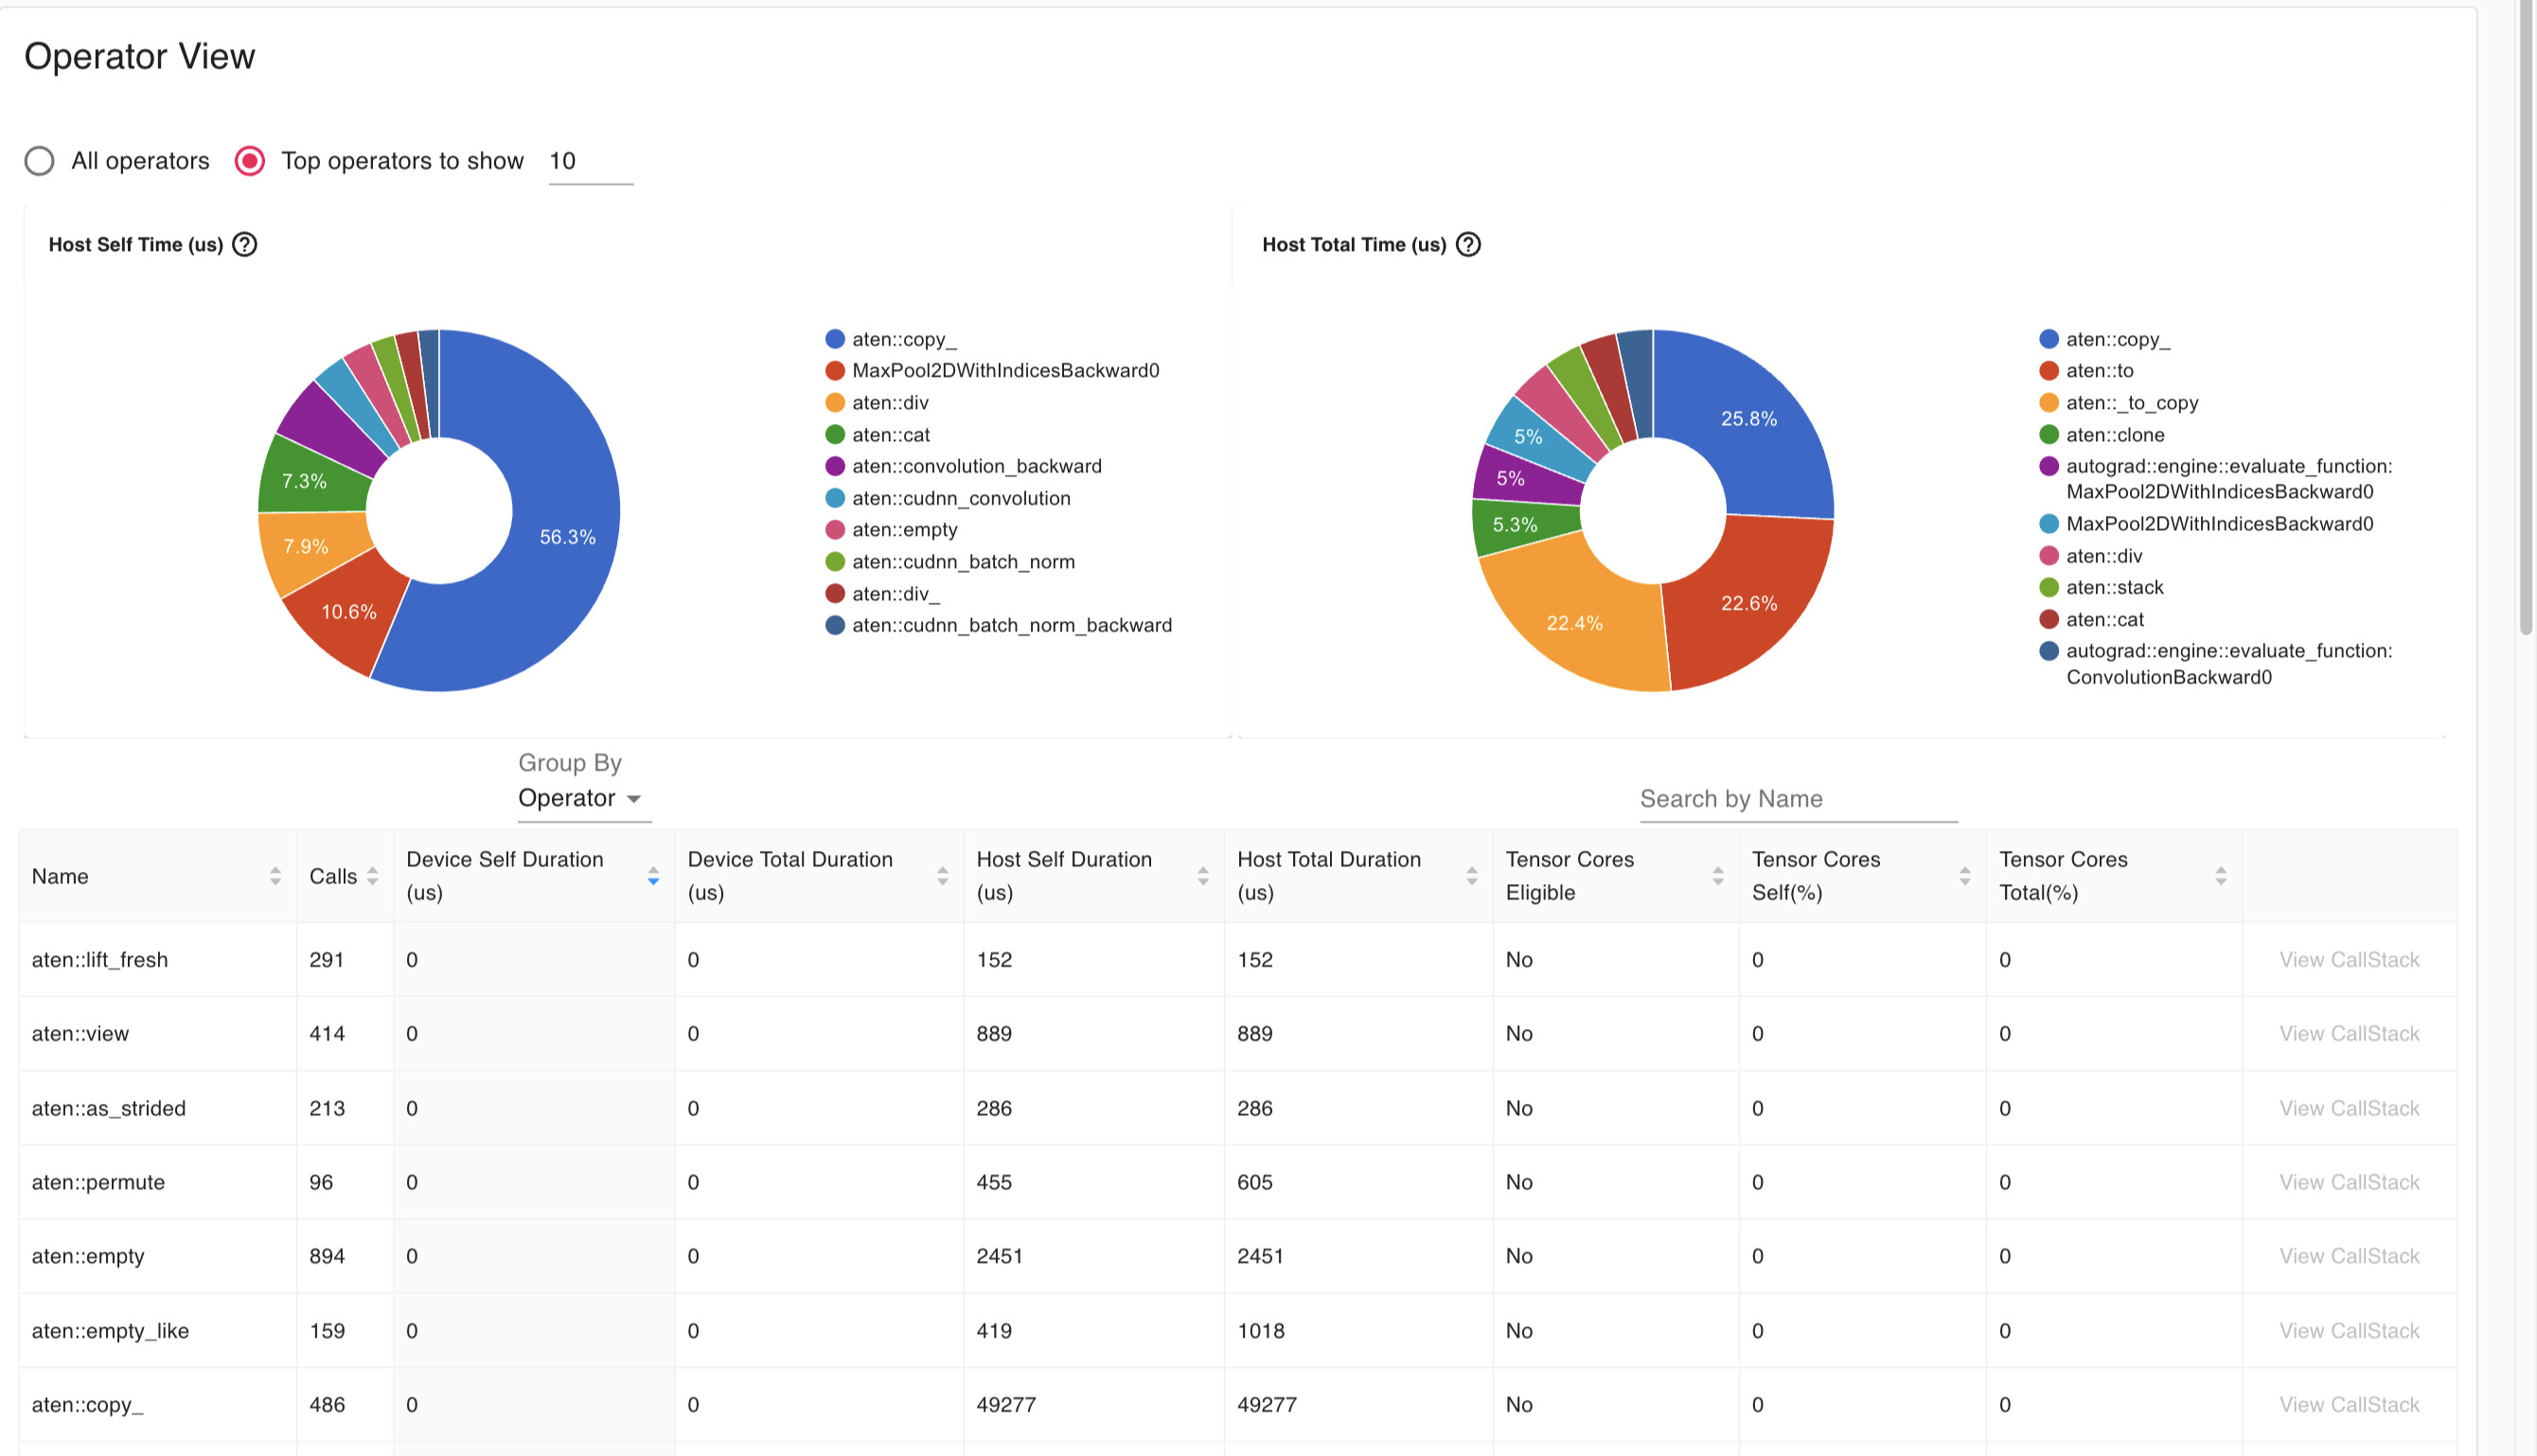
So, I want to know how to solve this issue to view the stack successfully?
I installed pytorch through the official command line and version is 2.0.
Other system config:
OS: Ubuntu 18.04
CUDA: 11.3 (Titan Xp)
Thanks!