PyTorch stop using cuda after reboot in Linux Mint 21.3

Hi, I’m a begginer in PyTorch and I’m running into a problem with CUDA.

I want to finetune a MobileNetV3 to a Binary classification and the script seems to be OK, it shows that the cuda is available and the device is set to ‘cuda’ for all inputs, targets and models, but it seems that the GPU is not being used.

Now, it took +40min to train one epoch, and I know that it can be done in ~3min, because yesterday (02/22/2024) I was able to run it in the GPU, after install CUDA Toolkit 12.3 manually and update the nvidia drivers to 545, and that was what it took to train one epoch.

But today, after rebooting my PC the GPU stopped being used.

I already uninstalled and installed Pytorch 2.2.1 with cuda121 but it’s still not working.

For now, I cleaned my PC and left just PyTorch 2.2.1+cuda121 installed, but it’s still not working.

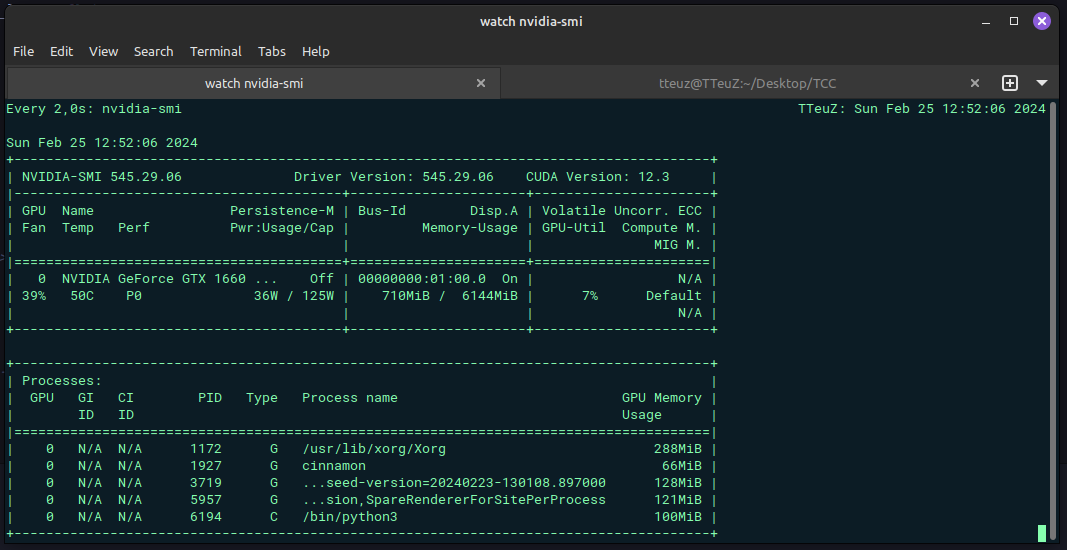
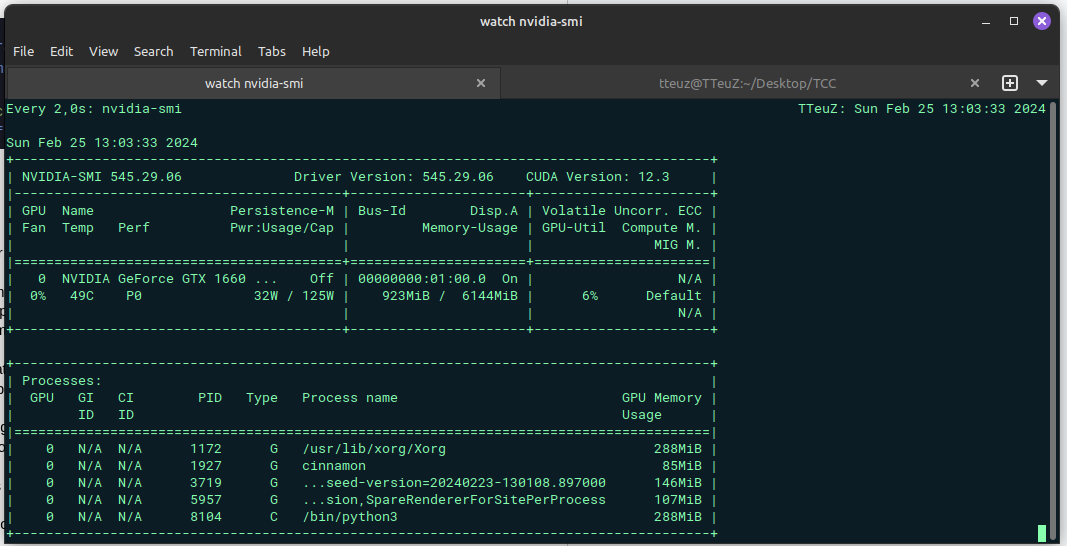
When the script is running, I can see the memory being allocated in the GPU (watch nvidia-smi) but it seems that it isn’t processing the images there.

I’m running the script in a Python notebook, using Linux mint 21.3, here are some details about my pc and the code.

My pc:
Operating System: Linux-x86_64 (MInt 21.3)
NVIDIA Driver Version: 545.29.06
NVML Version: 12.545.29.06
GPU 0 : NVIDIA GeForce GTX 1660 SUPER
CPU: Intel i5-9400F (6) @ 4.100GHz
RAM: 16GB

Code (Verify CUDA Available):

print(f"PyTorch version: {torch.__version__}")

print("--------------------------------------------------")
print(f"Using cuda: {torch.cuda.is_available()}")
print(f"Cuda corrent device: {torch.cuda.current_device()}")
print(f"Cuda device: {torch.cuda.get_device_name(torch.cuda.current_device())}")
print(f"Torch Backend enable: {torch.backends.cudnn.enabled}")
print(f"Torch Backend: {torch.backends.cudnn.version() }")
-----------------------------------------------------------------------------------------------------------------
PyTorch version: 2.2.1+cu121
--------------------------------------------------
Using cuda: True
Cuda corrent device: 0
Cuda device: NVIDIA GeForce GTX 1660 SUPER
Torch Backend enable: True
Torch Backend: 8902

Code (Inputs, targets, labels and model in GPU):

NUM_EPOCHS = 1
for epoch in range(NUM_EPOCHS):
    model.train()
    running_loss = 0.0

    for inputs, labels in train_loader:
        inputs, labels = inputs.to(device), labels.to(device)
        optimizer.zero_grad()

        preds = model(inputs).squeeze(1)
        loss = bce_loss(preds, labels.float())

        loss.backward()
        optimizer.step()

        print(f"inputs device: {inputs.device}, labels device: {labels.device}, model device: {next(model.parameters()).device}, preds: {preds.device}, model: {next(model.parameters()).device}")

        running_loss += loss.item() * inputs.size(0)
    
    epoch_loss = running_loss / len(train)
    print(f"Epoch [{epoch + 1}/{NUM_EPOCHS}], Training Loss: {epoch_loss:.4f}")
Print return:
inputs device: cuda:0, labels device: cuda:0, model device: cuda:0, preds: cuda:0, model: cuda:0
...

nvidia-smi with script running:

We can verify that the python allocated memory in the GPU, but the GPU is not being used for processing. As i said, yesterday (02/22/2024) when the GPU was entirely used, the GPU use stayed near to 100% and the power usage near to 125w.

Full code:

import torch
from torchvision.models import mobilenet_v3_large as mobilenet
from torchvision.models import MobileNet_V3_Large_Weights as pre_weights
from sklearn.metrics import confusion_matrix, accuracy_score
import helpers.data_handler as data_handler
import helpers.utils as utils

print(f"PyTorch version: {torch.__version__}")
print("--------------------------------------------------")
print(f"Using cuda: {torch.cuda.is_available()}")
print(f"Cuda corrent device: {torch.cuda.current_device()}")
print(f"Cuda device: {torch.cuda.get_device_name(torch.cuda.current_device())}")
print(f"Torch Backend enable: {torch.backends.cudnn.enabled}")
print(f"Torch Backend: {torch.backends.cudnn.version() }")

NUM_CLASSES = 1
train, validation, test = data_handler.get_datasets()
print(f"Train dataset size: {len(train)}")
print(f"validation dataset size: {len(validation)}")
print(f"test dataset size: {len(test)}")

train_loader = torch.utils.data.DataLoader(train, batch_size=32, shuffle=True, num_workers=4, pin_memory=True)
val_loader = torch.utils.data.DataLoader(validation, batch_size=1500, shuffle=False, num_workers=4, pin_memory=True)
test_loader = torch.utils.data.DataLoader(test, batch_size=1500, shuffle=False, num_workers=4, pin_memory=True)

model = mobilenet(weights=pre_weights.IMAGENET1K_V2)
model.classifier[-1] = torch.nn.Linear(1280, NUM_CLASSES)

bce_loss = torch.nn.BCEWithLogitsLoss()
optimizer = torch.optim.SGD(model.parameters(), lr=0.001, momentum=0.9)

device = torch.device("cuda" if torch.cuda.is_available() else "cpu")
model = model.to(device)

print(model.classifier)
print(f"is in cuda: {next(model.parameters()).is_cuda}")
print(f"device: {device}")

NUM_EPOCHS = 1
for epoch in range(NUM_EPOCHS):
   model.train()
   running_loss = 0.0

   for inputs, labels in train_loader:
       inputs, labels = inputs.to(device), labels.to(device)
       optimizer.zero_grad()

       preds = model(inputs).squeeze(1)
       loss = bce_loss(preds, labels.float())

       loss.backward()
       optimizer.step()

       print(f"inputs device: {inputs.device}, labels device: {labels.device}, model device: {next(model.parameters()).device}, preds: {preds.device}, model: {next(model.parameters()).device}")

       running_loss += loss.item() * inputs.size(0)
  
   epoch_loss = running_loss / len(train)
   print(f"Epoch [{epoch + 1}/{NUM_EPOCHS}], Training Loss: {epoch_loss:.4f}")

   # Validation
   model.eval()

   val_labels = []
   val_preds = []
   with torch.no_grad():
       for inputs, labels in val_loader:
           inputs, labels = inputs.to(device), labels.to(device)
           preds = model(inputs)

           val_labels.extend(labels.cpu().numpy())
           val_preds.extend((torch.sigmoid(preds) > 0.5).cpu().numpy().astype(int))

   accuracy = accuracy_score(val_labels, val_preds)
   cm = confusion_matrix(val_labels, val_preds)
  
   print(f'Validation Accuracy: {accuracy:.2f}%')
   utils.print_confusion_matrix(cm)

# Test
model.eval()

test_labels = []
test_preds = []
with torch.no_grad():
   for inputs, labels in test_loader:
       inputs, labels = inputs.to(device), labels.to(device)
       preds = model(inputs)

       test_labels.extend(labels.cpu().numpy())
       test_preds.extend((torch.sigmoid(preds) > 0.5).cpu().numpy().astype(int))

accuracy = accuracy_score(test_labels, test_preds)
cm = confusion_matrix(test_labels, test_preds)

print(f'Test Accuracy: {accuracy:.2f}%')
utils.print_confusion_matrix(cm)

Do you guys know what I can do to make it use GPU correctly?

Your GPU is already used if tensors were properly moved to it. Profile your code with Nsight Systems and check where the bottleneck in your code is.

Hi ptrblck, thanks for your help!

I’m trying to profile my code following your post (Using Nsight Systems to profile GPU workload - NVIDIA CUDA - PyTorch Dev Discussions), but first I decided to check if my inputs and labels from the dataloader are being allocated in the GPU.

In order to check that I commented the code and left only the inputs, labels = inputs.to(device), labels.to(device) in my training loop.

It seems to be setting the device to CUDA, but, when I look at the nvidia-smi, I can check that the labels are not in the GPU.

This 100MiB used is from the model that I uploaded in the GPU one step before.

The new loop code looks like this:

NUM_EPOCHS = 1
for epoch in range(NUM_EPOCHS):
    model.train()
    running_loss = 0.0

    for inputs, labels in train_loader:
        inputs, labels = inputs.to(device), labels.to(device)

        print(f"inputs device: {inputs.device}, labels device: {labels.device}")
        # optimizer.zero_grad()

        # preds = model(inputs).squeeze(1)
        # loss = bce_loss(preds, labels.float())

        # loss.backward()
        # optimizer.step()

        # running_loss += loss.item() * inputs.size(0)
output:
inputs device: cuda:0, labels device: cuda:0

The dataloader used is this:

train_loader = torch.utils.data.DataLoader(train, batch_size=32, shuffle=True, num_workers=4, pin_memory=True)
val_loader = torch.utils.data.DataLoader(validation, batch_size=1500, shuffle=False, num_workers=4, pin_memory=True)
test_loader = torch.utils.data.DataLoader(test, batch_size=1500, shuffle=False, num_workers=4, pin_memory=True)

The train, validation and test dataset are PyTorch ConcatDatasets loaded from my computer.

I think that the memory use shoudl increase if the tersors are being allocated there, right?

Actually, I increased the batch size for training to 1000 and I could see an memory use increase in nvidia-smi, I think that this is not the problem

To do a quick check, I modified the script to run only the train phase for 20 iterations and profile it with torch.utils.bottleneck.

Code:

import torch
from torchvision.models import mobilenet_v3_large as mobilenet
from torchvision.models import MobileNet_V3_Large_Weights as pre_weights

import helpers.data_handler as data_handler
import helpers.utils as utils

if __name__ == "__main__":
    NUM_CLASSES = 1
    NUM_EPOCHS = 1

    print(f"PyTorch version: {torch.__version__}")

    print("--------------------------------------------------")
    print(f"Using cuda: {torch.cuda.is_available()}")
    print(f"Cuda corrent device: {torch.cuda.current_device()}")
    print(f"Cuda device: {torch.cuda.get_device_name(torch.cuda.current_device())}")
    print(f"Torch Backend enable: {torch.backends.cudnn.enabled}")
    print(f"Torch Backend: {torch.backends.cudnn.version() }")

    train, validation, test = data_handler.get_datasets()
    print(f"Train dataset size: {len(train)}")
    print(f"validation dataset size: {len(validation)}")
    print(f"test dataset size: {len(test)}")

    train_loader = torch.utils.data.DataLoader(train, batch_size=32, shuffle=True, num_workers=4, pin_memory=True)
    val_loader = torch.utils.data.DataLoader(validation, batch_size=1500, shuffle=False, num_workers=4, pin_memory=True)
    test_loader = torch.utils.data.DataLoader(test, batch_size=1500, shuffle=False, num_workers=4, pin_memory=True)

    model = mobilenet(weights=pre_weights.IMAGENET1K_V2)
    model.classifier[-1] = torch.nn.Linear(1280, NUM_CLASSES)

    bce_loss = torch.nn.BCEWithLogitsLoss()
    optimizer = torch.optim.SGD(model.parameters(), lr=0.001, momentum=0.9)

    device = torch.device("cuda" if torch.cuda.is_available() else "cpu")
    model = model.to(device)

    print(model.classifier)
    print(f"is in cuda: {next(model.parameters()).is_cuda}")
    print(f"device: {device}")

    for epoch in range(NUM_EPOCHS):
        model.train()
        running_loss = 0.0

        loops = 20
        count = 0
        for inputs, labels in train_loader:
            if count == loops:
                break

            inputs, labels = inputs.to(device), labels.to(device)
            optimizer.zero_grad()

            preds = model(inputs).squeeze(1)
            loss = bce_loss(preds, labels.float())

            loss.backward()
            optimizer.step()
            
            running_loss += loss.item() * inputs.size(0)
            count += 1
        
        epoch_loss = running_loss / len(train)
        print(f"Epoch [{epoch + 1}/{NUM_EPOCHS}], Training Loss: {epoch_loss:.4f}")

Result:

-------------------------------------------------------------------------------
  Environment Summary
--------------------------------------------------------------------------------
PyTorch 2.2.1+cu121 DEBUG compiled w/ CUDA 12.1
Running with Python 3.10 and CUDA 12.3.107

`pip3 list` truncated output:
numpy==1.26.4
torch==2.2.1
torchaudio==2.2.1
torchvision==0.17.1
triton==2.2.0
--------------------------------------------------------------------------------
  cProfile output
--------------------------------------------------------------------------------
         13015644 function calls (12978027 primitive calls) in 13.746 seconds

   Ordered by: internal time
   List reduced from 6563 to 15 due to restriction <15>

   ncalls  tottime  percall  cumtime  percall filename:lineno(function)
      173    4.874    0.028    4.874    0.028 {method 'acquire' of '_thread.lock' objects}
   696416    0.717    0.000    1.127    0.000 /usr/lib/python3.10/posixpath.py:71(join)
        6    0.696    0.116    0.696    0.116 {method 'poll' of 'select.poll' objects}
      117    0.653    0.006    0.655    0.006 {built-in method _imp.create_dynamic}
     1240    0.516    0.000    0.516    0.000 {built-in method torch.conv2d}
      145    0.453    0.003    3.289    0.023 /home/tteuz/.local/lib/python3.10/site-packages/torchvision/datasets/folder.py:48(make_dataset)
   696803    0.367    0.000    0.382    0.000 {built-in method builtins.next}
      548    0.365    0.001    0.811    0.001 /usr/lib/python3.10/os.py:345(_walk)
     1343    0.362    0.000    0.362    0.000 {method 'read' of '_io.BufferedReader' objects}
       20    0.341    0.017    0.341    0.017 {method 'run_backward' of 'torch._C._EngineBase' objects}
   695851    0.340    0.000    0.589    0.000 /home/tteuz/.local/lib/python3.10/site-packages/torchvision/datasets/folder.py:10(has_file_allowed_extension)
       22    0.219    0.010    0.219    0.010 {method 'item' of 'torch._C.TensorBase' objects}
  1397120    0.163    0.000    0.163    0.000 {method 'endswith' of 'str' objects}
   695851    0.146    0.000    0.735    0.000 /home/tteuz/.local/lib/python3.10/site-packages/torchvision/datasets/folder.py:75(is_valid_file)
      312    0.144    0.000    0.150    0.000 /home/tteuz/.local/lib/python3.10/site-packages/torch/serialization.py:1367(load_tensor)


--------------------------------------------------------------------------------
  autograd profiler output (CUDA mode)
--------------------------------------------------------------------------------
        top 15 events sorted by cpu_time_total

	Because the autograd profiler uses the CUDA event API,
	the CUDA time column reports approximately max(cuda_time, cpu_time).
	Please ignore this output if your code does not use CUDA.

-------------------------------------------------------  ------------  ------------  ------------  ------------  ------------  ------------  ------------  ------------  ------------  ------------  
                                                   Name    Self CPU %      Self CPU   CPU total %     CPU total  CPU time avg     Self CUDA   Self CUDA %    CUDA total  CUDA time avg    # of Calls  
-------------------------------------------------------  ------------  ------------  ------------  ------------  ------------  ------------  ------------  ------------  ------------  ------------  
enumerate(DataLoader)#_MultiProcessingDataLoaderIter...        23.48%        1.396s        23.56%        1.401s        1.401s        1.401s        23.56%        1.401s        1.401s             1  
enumerate(DataLoader)#_MultiProcessingDataLoaderIter...        21.35%        1.270s        21.35%        1.270s        1.270s        1.270s        21.35%        1.270s        1.270s             1  
enumerate(DataLoader)#_MultiProcessingDataLoaderIter...        14.76%     877.930ms        14.76%     877.947ms     877.947ms     878.000ms        14.77%     878.000ms     878.000ms             1  
enumerate(DataLoader)#_MultiProcessingDataLoaderIter...        13.62%     810.116ms        13.62%     810.133ms     810.133ms     810.182ms        13.62%     810.182ms     810.182ms             1  
enumerate(DataLoader)#_MultiProcessingDataLoaderIter...        13.34%     793.190ms        13.34%     793.208ms     793.208ms     793.260ms        13.34%     793.260ms     793.260ms             1  
enumerate(DataLoader)#_MultiProcessingDataLoaderIter...        10.16%     604.267ms        10.16%     604.284ms     604.284ms     604.328ms        10.16%     604.328ms     604.328ms             1  
enumerate(DataLoader)#_MultiProcessingDataLoaderIter...         1.57%      93.502ms         1.57%      93.518ms      93.518ms      93.544ms         1.57%      93.544ms      93.544ms             1  
enumerate(DataLoader)#_MultiProcessingDataLoaderIter...         1.36%      81.054ms         1.36%      81.063ms      81.063ms      81.095ms         1.36%      81.095ms      81.095ms             1  
                                Optimizer.step#SGD.step         0.06%       3.731ms         0.27%      15.877ms      15.877ms       1.185ms         0.02%       6.794ms       6.794ms             1  
                                Optimizer.step#SGD.step         0.01%     814.000us         0.13%       7.554ms       7.554ms       6.000us         0.00%       2.807ms       2.807ms             1  
                                         aten::uniform_         0.12%       7.155ms         0.12%       7.155ms       7.155ms       7.164ms         0.12%       7.164ms       7.164ms             1  
                                Optimizer.step#SGD.step         0.01%     747.000us         0.12%       7.152ms       7.152ms       5.000us         0.00%       1.565ms       1.565ms             1  
                                Optimizer.step#SGD.step         0.01%     742.000us         0.12%       7.011ms       7.011ms       5.000us         0.00%       1.565ms       1.565ms             1  
                                         aten::uniform_         0.11%       6.807ms         0.11%       6.807ms       6.807ms       6.815ms         0.11%       6.815ms       6.815ms             1  
                                Optimizer.step#SGD.step         0.01%     722.000us         0.11%       6.736ms       6.736ms       5.000us         0.00%       1.567ms       1.567ms             1  
-------------------------------------------------------  ------------  ------------  ------------  ------------  ------------  ------------  ------------  ------------  ------------  ------------  
Self CPU time total: 5.947s
Self CUDA time total: 5.946s

I’m not sure about how i can interpret this results

Your data loading pipeline seems to be the bottleneck and the GPU is still used as you’ve verified now.

Is there a way to improve the data loading pipeline? I already checked about parameters for the DataLoader function and it seems that I’m building it right.

the weirdest part is that this same code ran really fast before.

A good post about data loading bottlenecks can be found here.
However, you should also try to figure out what exactly might have changed between your previous run and now as it seems the data loading became the bottleneck now. E.g. did you move the data from a local SSD to a network storage, did you increase the size of the sample, or added more preprocessing?

Thank you, I will go through this post and try to fix the issue.

As far I can remember, the only thing that I changed was the number of features, from 2 to 1, and because of that, I changed the loss function to BCEWithlogistic and put an sigmoid to choose the right class in the validation loop, nothing was changed In the train loop and in the data loaders.

The whole dataset is located in my personal HD in both runs.

After some attempts in this afternoon, I did some modifications in the code, now I’m using the fast_collate function and the data_prefetcher class from this example apex/examples/imagenet/main_amp.py at master · NVIDIA/apex · GitHub

Running with 100 training loops using the torch.utils.bottleneck It seems that it improved a lot

From ~6seg with 20 iterations to 66ms with 100 iterations

total results from torch.utils.bottleneck:

--------------------------------------------------------------------------------
  Environment Summary
--------------------------------------------------------------------------------
PyTorch 2.2.1+cu121 DEBUG compiled w/ CUDA 12.1
Running with Python 3.10 and CUDA 12.3.107

`pip3 list` truncated output:
numpy==1.26.4
torch==2.2.1
torchaudio==2.2.1
torchvision==0.17.1
triton==2.2.0
--------------------------------------------------------------------------------
  cProfile output
--------------------------------------------------------------------------------
         12817055 function calls (12743722 primitive calls) in 8.231 seconds

   Ordered by: internal time
   List reduced from 4693 to 15 due to restriction <15>

   ncalls  tottime  percall  cumtime  percall filename:lineno(function)
      101    1.263    0.013    1.263    0.013 {method 'item' of 'torch._C.TensorBase' objects}
   696390    0.781    0.000    1.191    0.000 /usr/lib/python3.10/posixpath.py:71(join)
      100    0.774    0.008    0.774    0.008 {method 'run_backward' of 'torch._C._EngineBase' objects}
      145    0.448    0.003    3.340    0.023 /home/tteuz/.local/lib/python3.10/site-packages/torchvision/datasets/folder.py:48(make_dataset)
     6200    0.416    0.000    0.416    0.000 {built-in method torch.conv2d}
696956/696752    0.362    0.000    0.476    0.000 {built-in method builtins.next}
      548    0.358    0.001    0.798    0.001 /usr/lib/python3.10/os.py:345(_walk)
   695851    0.344    0.000    0.591    0.000 /home/tteuz/.local/lib/python3.10/site-packages/torchvision/datasets/folder.py:10(has_file_allowed_extension)
     4600    0.173    0.000    0.173    0.000 {built-in method torch.batch_norm}
  1396338    0.160    0.000    0.160    0.000 {method 'endswith' of 'str' objects}
      402    0.158    0.000    0.158    0.000 {method 'acquire' of '_thread.lock' objects}
   695851    0.148    0.000    0.739    0.000 /home/tteuz/.local/lib/python3.10/site-packages/torchvision/datasets/folder.py:75(is_valid_file)
1568119/1566716    0.136    0.000    0.138    0.000 {built-in method builtins.isinstance}
  1081748    0.135    0.000    0.135    0.000 {method 'startswith' of 'str' objects}
   696496    0.129    0.000    0.187    0.000 /usr/lib/python3.10/posixpath.py:41(_get_sep)


--------------------------------------------------------------------------------
  autograd profiler output (CPU mode)
--------------------------------------------------------------------------------
        top 15 events sorted by cpu_time_total

-------------------------------------------------------  ------------  ------------  ------------  ------------  ------------  ------------  
                                                   Name    Self CPU %      Self CPU   CPU total %     CPU total  CPU time avg    # of Calls  
-------------------------------------------------------  ------------  ------------  ------------  ------------  ------------  ------------  
enumerate(DataLoader)#_MultiProcessingDataLoaderIter...        63.98%      65.318ms        77.53%      79.153ms      79.153ms             1  
                                             aten::item         0.00%       3.000us        10.16%      10.374ms      10.374ms             1  
                              aten::_local_scalar_dense         0.01%       8.000us        10.16%      10.371ms      10.371ms             1  
                                        cudaMemcpyAsync        10.15%      10.360ms        10.15%      10.360ms      10.360ms             1  
                                             aten::item         0.00%       5.000us         8.66%       8.840ms       8.840ms             1  
                              aten::_local_scalar_dense         0.01%      12.000us         8.65%       8.835ms       8.835ms             1  
                                             aten::item         0.00%       4.000us         8.65%       8.835ms       8.835ms             1  
                              aten::_local_scalar_dense         0.01%      10.000us         8.65%       8.831ms       8.831ms             1  
                                        cudaMemcpyAsync         8.64%       8.817ms         8.64%       8.817ms       8.817ms             1  
                                        cudaMemcpyAsync         8.63%       8.816ms         8.63%       8.816ms       8.816ms             1  
                                             aten::item         0.00%       4.000us         8.56%       8.739ms       8.739ms             1  
                              aten::_local_scalar_dense         0.01%      11.000us         8.56%       8.735ms       8.735ms             1  
                                        cudaMemcpyAsync         8.54%       8.719ms         8.54%       8.719ms       8.719ms             1  
                                             aten::item         0.00%       2.000us         7.73%       7.892ms       7.892ms             1  
                              aten::_local_scalar_dense         0.01%       8.000us         7.73%       7.890ms       7.890ms             1  
-------------------------------------------------------  ------------  ------------  ------------  ------------  ------------  ------------  
Self CPU time total: 102.097ms

--------------------------------------------------------------------------------
  autograd profiler output (CUDA mode)
--------------------------------------------------------------------------------
        top 15 events sorted by cpu_time_total

	Because the autograd profiler uses the CUDA event API,
	the CUDA time column reports approximately max(cuda_time, cpu_time).
	Please ignore this output if your code does not use CUDA.

-------------------------------------------------------  ------------  ------------  ------------  ------------  ------------  ------------  ------------  ------------  ------------  ------------  
                                                   Name    Self CPU %      Self CPU   CPU total %     CPU total  CPU time avg     Self CUDA   Self CUDA %    CUDA total  CUDA time avg    # of Calls  
-------------------------------------------------------  ------------  ------------  ------------  ------------  ------------  ------------  ------------  ------------  ------------  ------------  
enumerate(DataLoader)#_MultiProcessingDataLoaderIter...        63.56%      42.548ms        63.57%      42.553ms      42.553ms      42.643ms        72.21%      42.643ms      42.643ms             1  
                                Optimizer.step#SGD.step         6.71%       4.493ms        30.87%      20.666ms      20.666ms       2.332ms         3.95%      16.957ms      16.957ms             1  
                                Optimizer.step#SGD.step         1.13%     758.000us        11.53%       7.719ms       7.719ms       5.000us         0.01%       1.927ms       1.927ms             1  
                                Optimizer.step#SGD.step         1.10%     734.000us        10.80%       7.232ms       7.232ms       4.000us         0.01%       1.932ms       1.932ms             1  
                                Optimizer.step#SGD.step         1.22%     815.000us        10.77%       7.212ms       7.212ms       7.000us         0.01%       3.381ms       3.381ms             1  
                                       aten::batch_norm         0.01%       6.000us        10.71%       7.170ms       7.170ms       3.000us         0.01%       7.389ms       7.389ms             1  
                           aten::_batch_norm_impl_index         0.01%       9.000us        10.70%       7.162ms       7.162ms       2.000us         0.00%       7.386ms       7.386ms             1  
                                 aten::cudnn_batch_norm         0.13%      86.000us        10.66%       7.135ms       7.135ms     448.000us         0.76%       7.384ms       7.384ms             1  
                                       aten::empty_like        10.39%       6.952ms        10.45%       6.998ms       6.998ms       6.876ms        11.64%       6.899ms       6.899ms             1  
                                Optimizer.step#SGD.step         1.12%     750.000us        10.32%       6.911ms       6.911ms       5.000us         0.01%       1.567ms       1.567ms             1  
                                Optimizer.step#SGD.step         1.14%     766.000us        10.13%       6.778ms       6.778ms       5.000us         0.01%       1.579ms       1.579ms             1  
                                Optimizer.step#SGD.step         1.13%     754.000us        10.08%       6.747ms       6.747ms       6.000us         0.01%       1.574ms       1.574ms             1  
enumerate(DataLoader)#_MultiProcessingDataLoaderIter...         9.98%       6.680ms         9.99%       6.686ms       6.686ms       6.711ms        11.36%       6.711ms       6.711ms             1  
                                Optimizer.step#SGD.step         1.17%     784.000us         9.59%       6.417ms       6.417ms       6.000us         0.01%       1.769ms       1.769ms             1  
                                Optimizer.step#SGD.step         1.20%     803.000us         9.47%       6.339ms       6.339ms       5.000us         0.01%       2.410ms       2.410ms             1  
-------------------------------------------------------  ------------  ------------  ------------  ------------  ------------  ------------  ------------  ------------  ------------  ------------  
Self CPU time total: 66.938ms
Self CUDA time total: 59.058ms

The final result with this modification got pretty close to that run that I mentioned and I could understand how to perform a performance troubleshooting, thanks a lot!

1 Like