Question aboout GPU computing

Hello, everyone. I have build the machine learning code with GPU calculation. It is running, but not fast as I expected. I do not know I have build the correct one.

I read the input data by:

Dataset = pd.read_csv('./Inputs.txt', sep = "\s+")
Target_Column = 9
X = Dataset.iloc[:, 0:Target_Column].values
Y = Dataset.iloc[:,   Target_Column].values

X_Train, X_Test, Y_Train, Y_Test = train_test_split(X, Y, test_size = 0.3, random_state = 0)

sc = StandardScaler()
X_Train = sc.fit_transform(X_Train)
X_Test = sc.transform(X_Test)

Then I use DataLoder as follows:

X_Train = torch.Tensor(X_Train)
Y_Train = torch.Tensor(Y_Train)

Train_Dataset = TensorDataset(X_Train, Y_Train)

Train_Dataloader = DataLoader(Train_Dataset, batch_size = Batch_Size, shuffle = True)

Then, when I calculating each iteration, I use following code:

for Epoch in range(Num_Epochs):
    #Shuffle just mixes up the dataset between epocs
    X_Train, Y_Train = shuffle(X_Train, Y_Train)
    
    # Mini batch learning
    for batch_idx, samples in enumerate(Train_Dataloader):
        X_Train = X_Train.to(Device)
        Y_Train = Y_Train.to(Device)

        # zero the parameter gradients
        optimizer.zero_grad()

        # forward + backward + optimize
        outputs = net(X_Train)
        loss = criterion(outputs, torch.unsqueeze(Y_Train,dim = 1))
        loss.backward()
        optimizer.step()

        # print statistics
        Running_Loss += loss.item()
        
    if(Epoch % 100 == 0): 
        File.write("%.4f\t%.4f\n" % (Epoch, Running_Loss))
        
    if(Epoch % 2 == 0): 
        print('Epoch {}'.format(Epoch), "Loss: ", Running_Loss)
    
    Running_Loss = 0.0

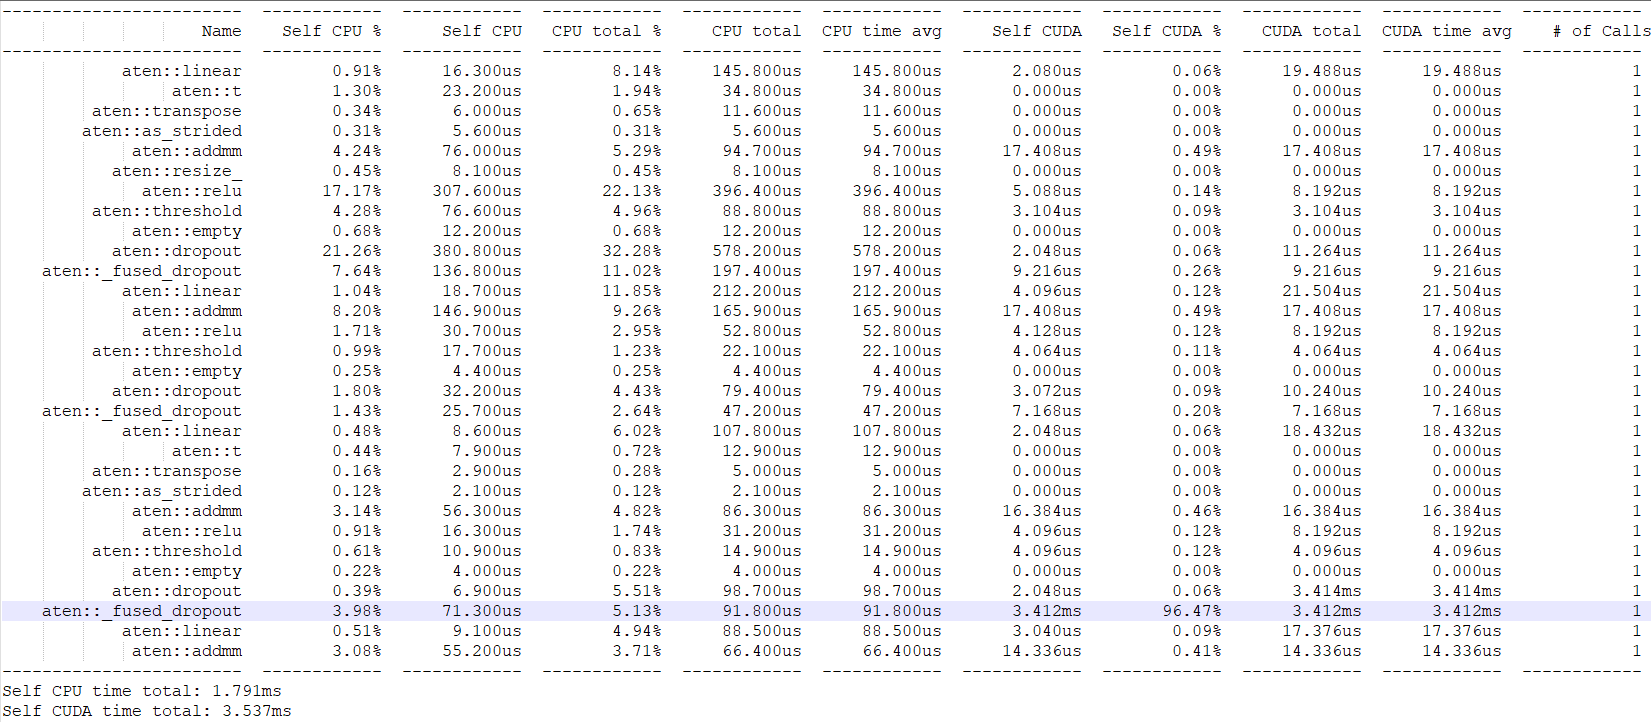
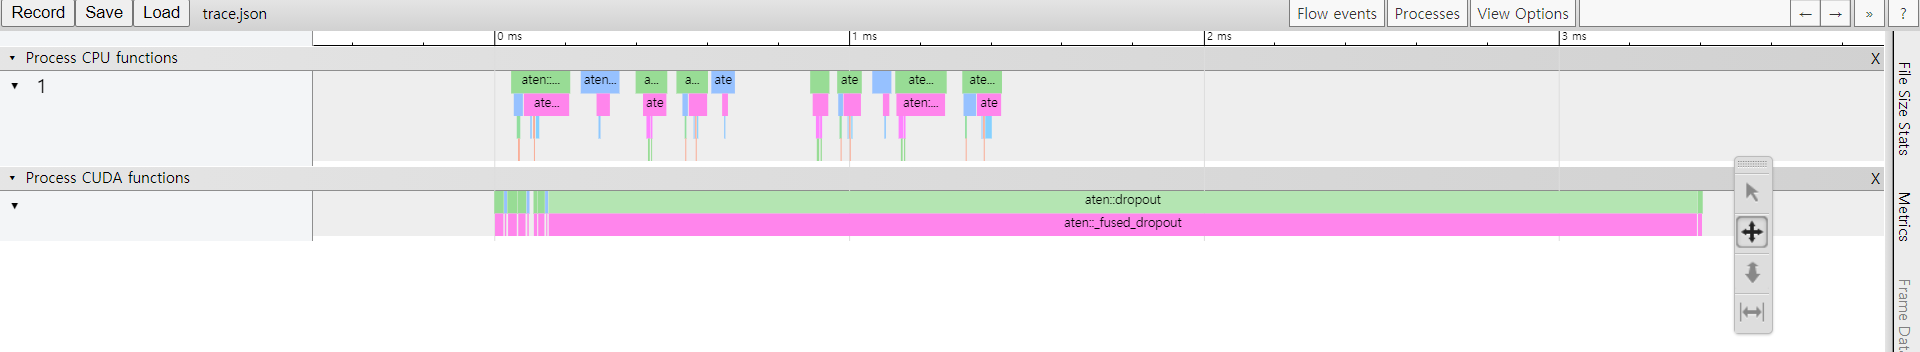
I have confirmed that the GPU is running with 50% usage. But not fast enough. Is there anything wrong in the process?

Thank you for your help.

You could profile your code e.g. via Nsight Systems or the PyTorch Profiler to see where the bottleneck in your code is and to further isolate it. E.g. your training might suffer from a slow data loading and could explain the 50% utilization of the GPU.

1 Like

Thank you for your comment! I will try to follow up the PyTorch Profiler to see what the problem is.

So if the code is correct, the usage of GPU should nearly 0%?

No, if you are not facing a CPU-bound bottleneck, such as the data loading, the GPU utilization should be high, since the GPU would be used to train the model and wouldn’t have to wait for the next data batch etc.

2 Likes

Since I am new to pytorch and python. I failed to generate the “Tensor Board”

Instead, I have obtain some profile using the following code:

with torch.autograd.profiler.profile(use_cuda=True) as prof:
    net(X_Train)
print(prof)

The result is as follows:

I can see the most of the time of CUDA is spent at “aten::_fused_dropout” stage, and the total time of CUDA is 3.537ms, but it takes 98.682 second to finish the model. Ans usage of GPU is almost 0% during calculating…

Is it possible to check whether GPU is applied properly?

I’m not familiar with this kind of output and don’t see any data loading part in it.
However, CUDA functions are mentioned, so I assume the GPU is used.
I’m also unsure, if you’ve added proper warmup iterations etc. as described in my short tutorial.

1 Like

I will try to Nsight System to check the usage of GPU as soon as I can. Thank you for your help!