Hi, this question might have been repeated but I can’t find an exact way to go around doing this.
I have loss functions and Mean squared error functions stored in the form of .pt files produced by an external script. An example of this .pt file is -
Would be really helpful if any code or instructions can be provided on how to load these files and read the numerical values. I was able to load and read the file, but the only output I receive is in the form of a tensor.
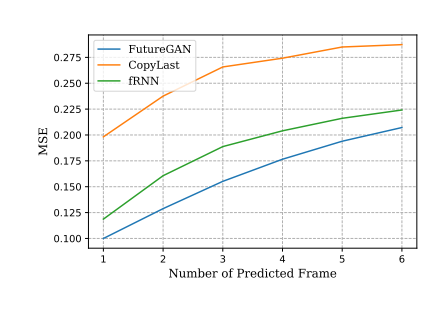
What I expect is, few numerical values sufficient to plot a graph like -