Hi,
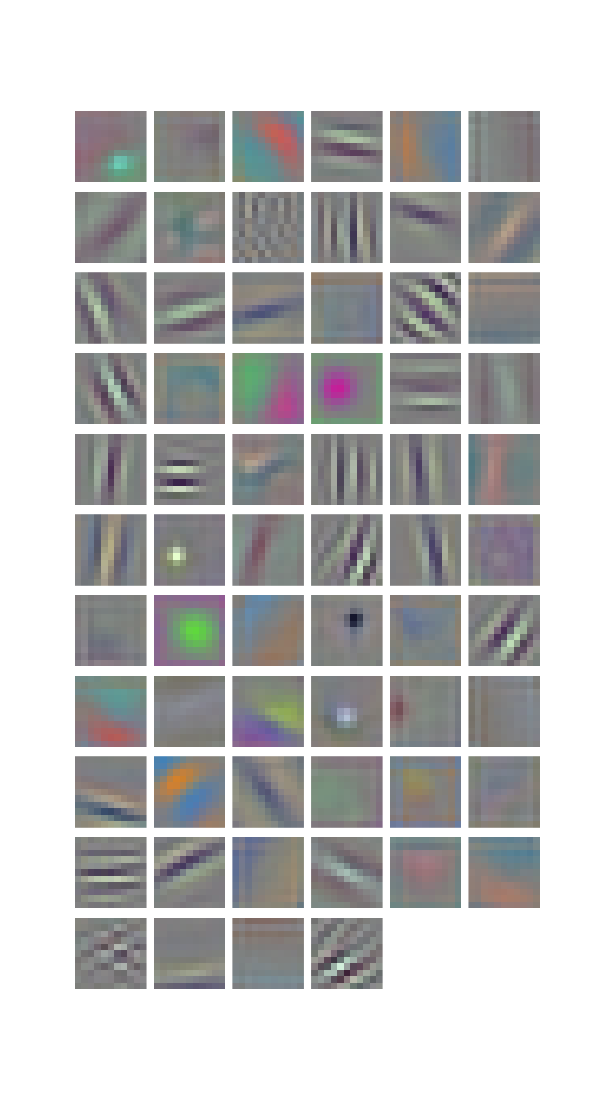
I’m trying to plot the kernels in my first layer but they don’t look right.
I used a pre trained AlexNet and there’s definitely structure but the colours seem off.
Here is a fairly minimal example:
import torchvision.models as models
import torchvision.transforms as transforms
import torch.nn as nn
import torch

import matplotlib
matplotlib.use('Agg')
import matplotlib.pyplot as plt

def plot_kernels(tensor, num_cols=6):
    num_rows = 11
    fig = plt.figure(figsize=(num_cols,num_rows))
    i = 0
    for t in tensor:
      ax1 = fig.add_subplot(num_rows,num_cols,i+1)
      pilTrans = transforms.ToPILImage()
      pilImg = pilTrans(t)
      ax1.imshow(pilImg, interpolation='none')
      print(tensor[i])
      ax1.axis('off')
      ax1.set_xticklabels([])
      ax1.set_yticklabels([])
      i+=1

    plt.subplots_adjust(wspace=0.1, hspace=0.1)
    plt.show()


alexnet = models.alexnet(pretrained=True)

i = 0
for m in alexnet.modules():
  if isinstance(m, nn.Conv2d):
    if i == 0:
      plot_kernels(m.weight.data.clone().cpu())
      plt.savefig('result.png')
Which results in:
So I guess it has something to do with the structure so I produced this example:
import torchvision.models as models
import torchvision.transforms as transforms
import torch.nn as nn
import torch

import matplotlib
matplotlib.use('Agg')
import matplotlib.pyplot as plt

def plot_kernels(tensor, num_cols=6):
    num_rows = 1
    fig = plt.figure(figsize=(num_cols,num_rows))
    i = 0
    for t in tensor:
      ax1 = fig.add_subplot(num_rows,num_cols,i+1)
      pilTrans = transforms.ToPILImage()
      pilImg = pilTrans(t)
      ax1.imshow(pilImg, interpolation='none')
      ax1.axis('off')
      ax1.set_xticklabels([])
      ax1.set_yticklabels([])
      i+=1

    plt.subplots_adjust(wspace=0.1, hspace=0.1)
    plt.show()


tensor = torch.FloatTensor([[
  [[0, 0, 0], [0, 0, 0], [0,0,0]], [[0, 0, 0], [0, 0, 0], [0,0,0]], [[1, 1, 1], [1, 1, 1], [1,1,1]],
  [[0, 0, 0], [0, 0, 0], [0,0,0]], [[0, 0, 0], [0, 0, 0], [0,0,0]], [[1, 1, 1], [1, 1, 1], [1,1,1]],
  [[0, 0, 0], [0, 0, 0], [0,0,0]], [[0, 0, 0], [0, 0, 0], [0,0,0]], [[1, 1, 1], [1, 1, 1], [1,1,1]],
  ],[
  [[1, 1, 1], [1, 1, 1], [1,1,1]], [[0, 0, 0], [0, 0, 0], [0,0,0]], [[0, 0, 0], [0, 0, 0], [0,0,0]],
  [[0, 0, 0], [0, 0, 0], [0,0,0]], [[1, 1, 1], [1, 1, 1], [1,1,1]],  [[0, 0, 0], [0, 0, 0], [0,0,0]],
  [[0, 0, 0], [0, 0, 0], [0,0,0]], [[0, 0, 0], [0, 0, 0], [0,0,0]], [[1, 1, 1], [1, 1, 1], [1,1,1]]
  ],
  ])

plot_kernels(tensor)
plt.savefig('result.png')
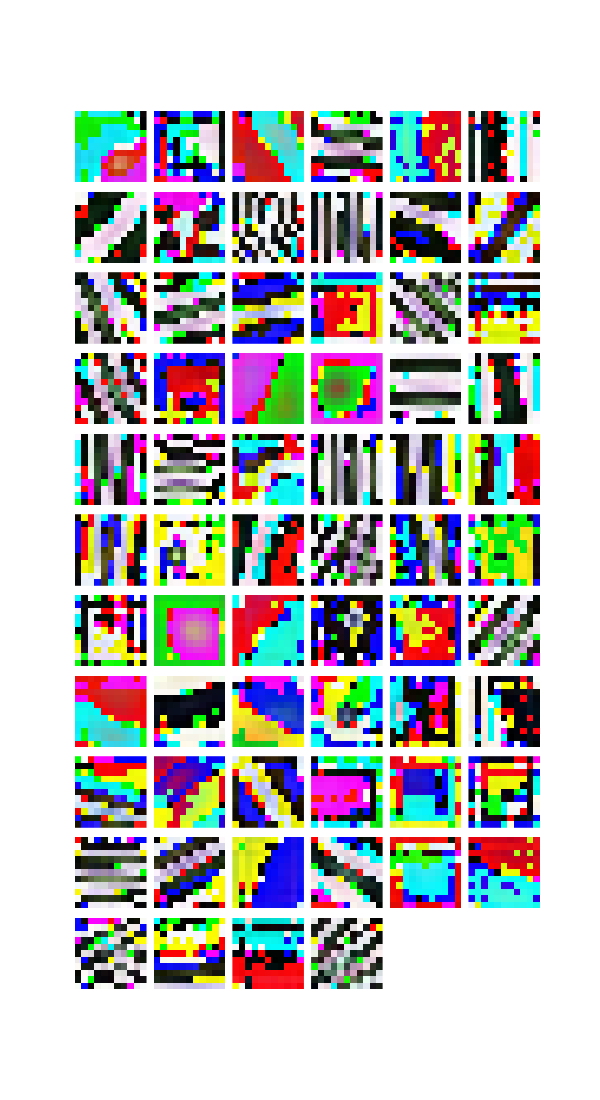
Which produces this result: (I can’t post a second image as I’m a new user ![]() )
)
I guess I expected a blue square and then either a black square with a white diagonal? What I get is vertical stripes of red, green then blue. I could see how they might be horizontal instead but I didn’t expect vertical ones?
Is this the right way to save the weights to look at their structure? How can I plot these weights with accurate colour?
Thanks!