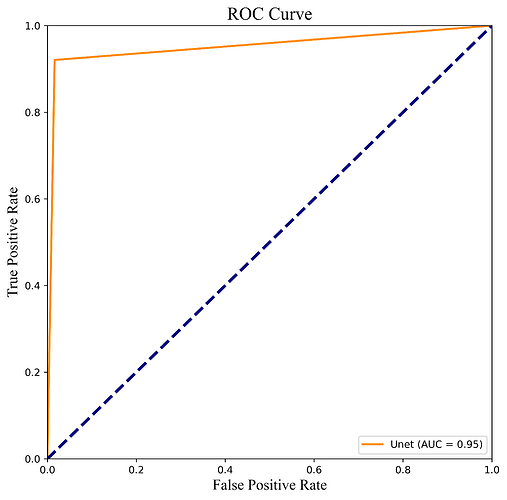
Hi,
When I plotted a ROC curve using a Unet model with a binary segmentation image, I found that the curve was not as smooth as a curve but appeared as a straight line with only three points, I can’t solve this problem. Please, anyone encountered such a situation, how to get a smooth curve. This is the code.
def roc(label, cd_preds):
fpr, tpr, thresholds = roc_curve(label, cd_preds)
roc_auc = auc(fpr, tpr)
plt.figure(figsize=(8,8))
plt.plot(fpr,
tpr,
color=‘darkorange’,
linestyle=‘-’,
lw=2,
label= ‘Unet (AUC = {0:0.2f})’
‘’.format(roc_auc))
plt.plot([0, 1], [0, 1], color=“navy”, lw=3, linestyle=‘–’)
plt.xlim([0.0, 1.0])
plt.ylim([0.0, 1.0])
plt.xlabel(‘False Positive Rate’)
plt.ylabel(‘True Positive Rate’)
plt.title(‘ROC Curve’)
plt.legend(loc=“lower right”)
plt.show()
dev = torch.device(‘cuda:0’ if torch.cuda.is_available() else ‘cpu’)
test_loader = get_test_loaders()
model = torch.load(opt.path, map_location=‘cpu’)
model.to(dev)
model.eval()
with torch.no_grad():
tbar = tqdm(test_loader)
for batch_img1, batch_img2, labels, fname in tbar:
    # Set variables for testing
    batch_img1 = batch_img1.float().to(dev)
    batch_img2 = batch_img2.float().to(dev)
    labels = labels.long().to(dev)

    # Get predictions
    cd_preds = model(batch_img1, batch_img2)
    cd_preds = cd_preds[-1]
    _, cd_preds = torch.max(cd_preds, 1)

    ROC_Plot = roc(labels.data.cpu().numpy().flatten(),
                     cd_preds.data.cpu().numpy().flatten())
