Hi there,
Anyone having any experience of running independent multiple models on a single gpu (RTX 3090 or RTX 3090 TI on PyTorch + windows11 ). I tried running two models to train and it takes double time when i run two separate models in separate power shell on windows (is there any limitations on rtxt 3090 or rtx 3090 TI) ? [its cifar10 and RAM is 64 gb and gpu ram is 24 gb and dataset is very small to fit in the RAM, so no memory read/write bottleneck].
Check if other compute resources are already exhausted on the device, as it would also disallow the parallel execution of different workloads.
If that’s not the case, check if Windows adds some limitation (I’m not using Windows and don’t know about all “modes” it could use the GPU in).
@ptrblck
Thanks, i checked that, i have 64 gb ram, and 24 gb gpu ram. And running cifar10 training which fits in the memory. When i run single model it takes around 4 minutes but when i run two independent in two seperately power shells, it takes 8 minutes for each which is weird and seems like some locking for RTX 3090 TI on windows11 ?
I wasn’t thinking about the device memory but the compute resources.
-
run cmd
-
type
nvidia-smi -
screenshot
This will show what percent of your device CUDA cores are being utilized.
(No load)
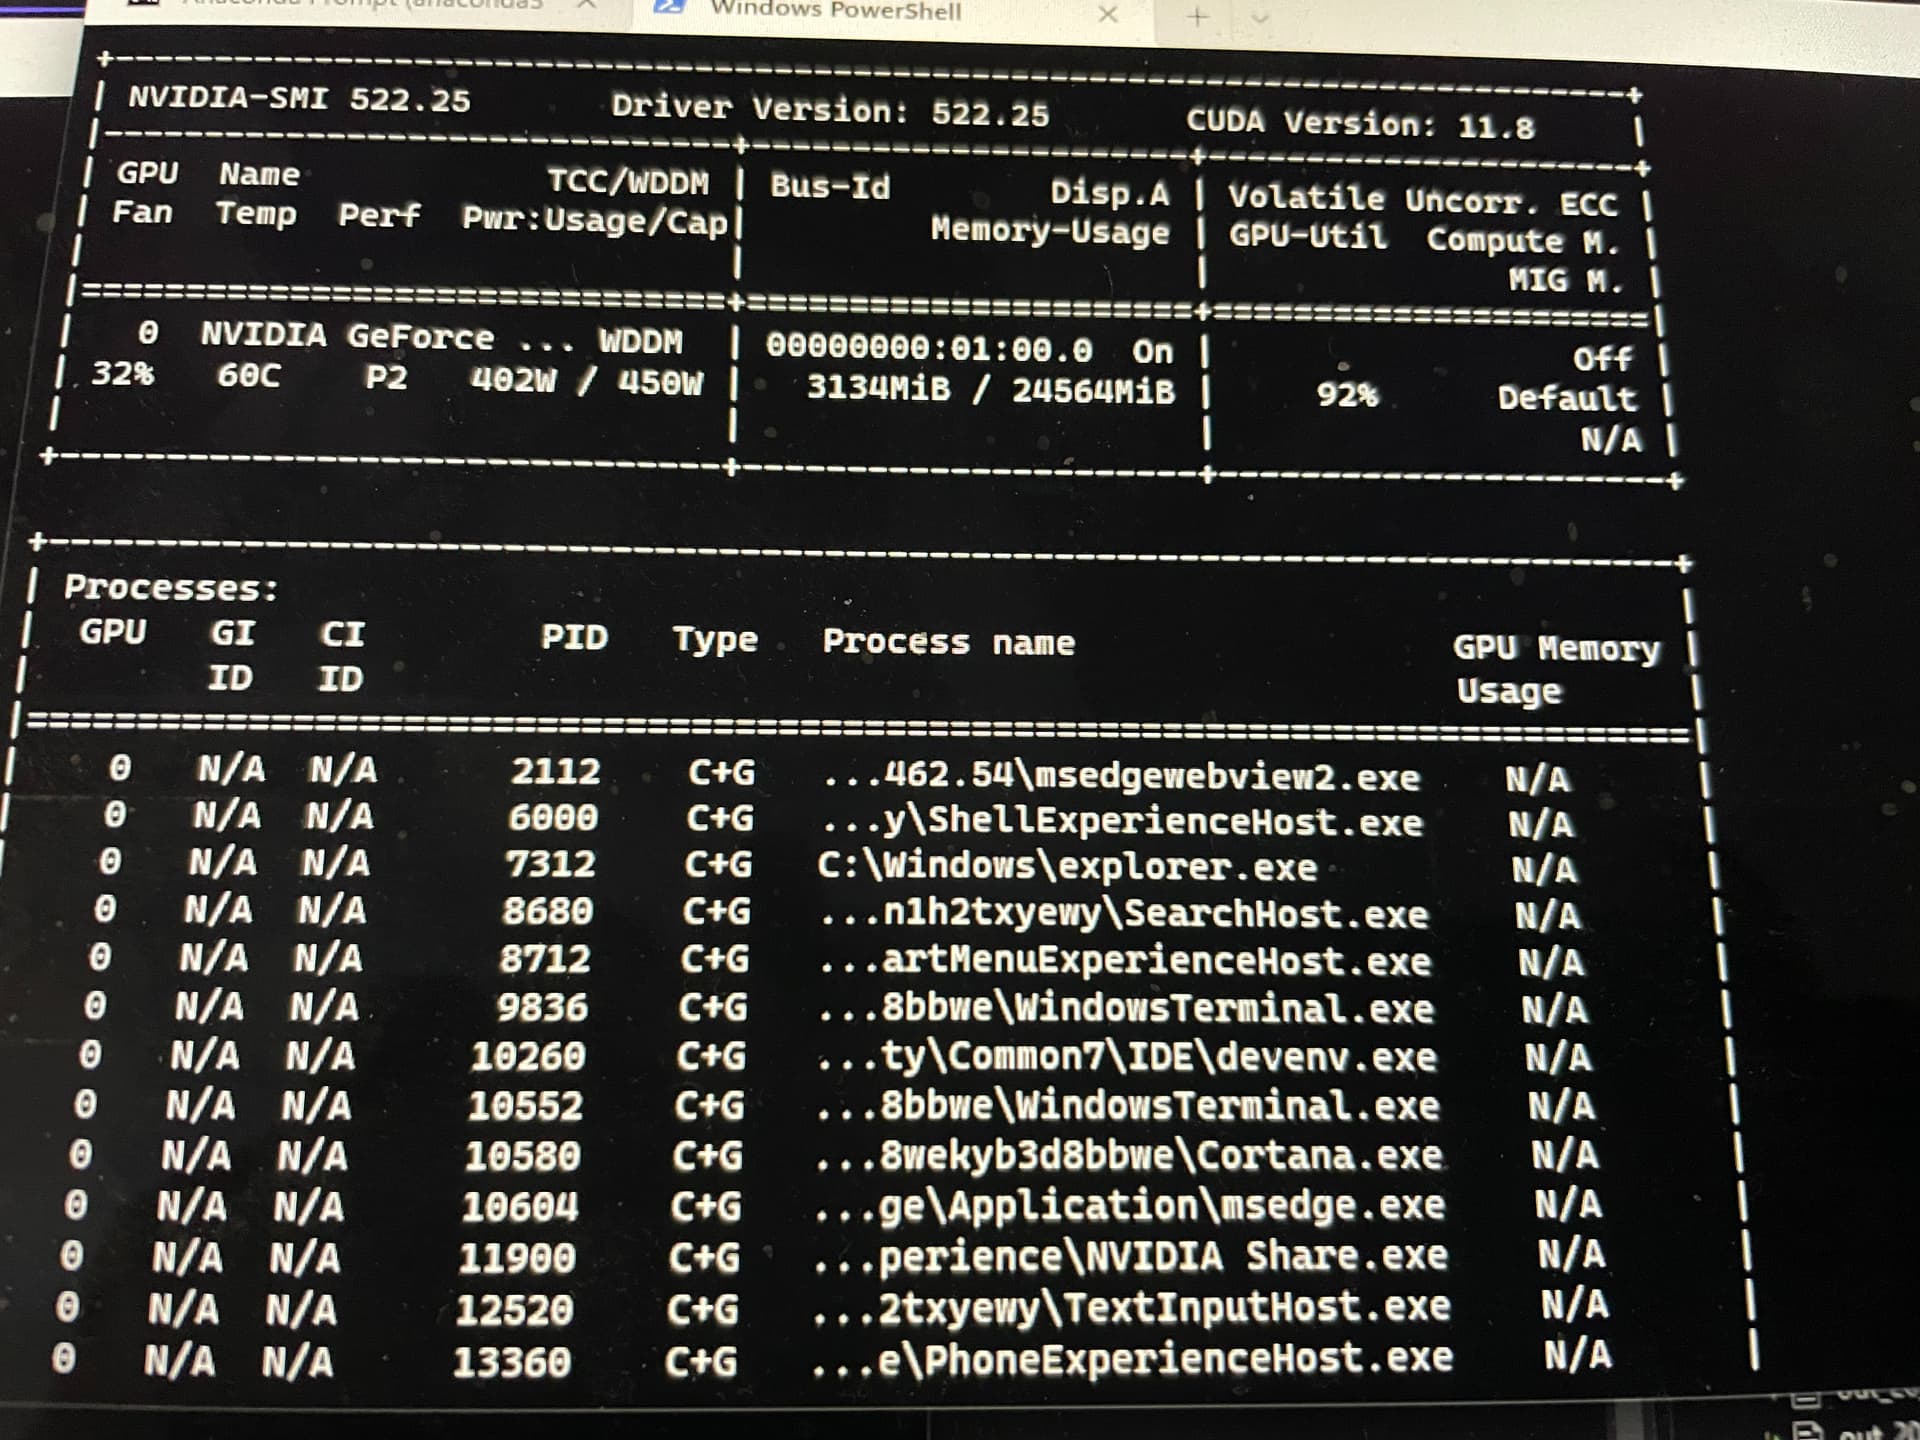
(single model training)
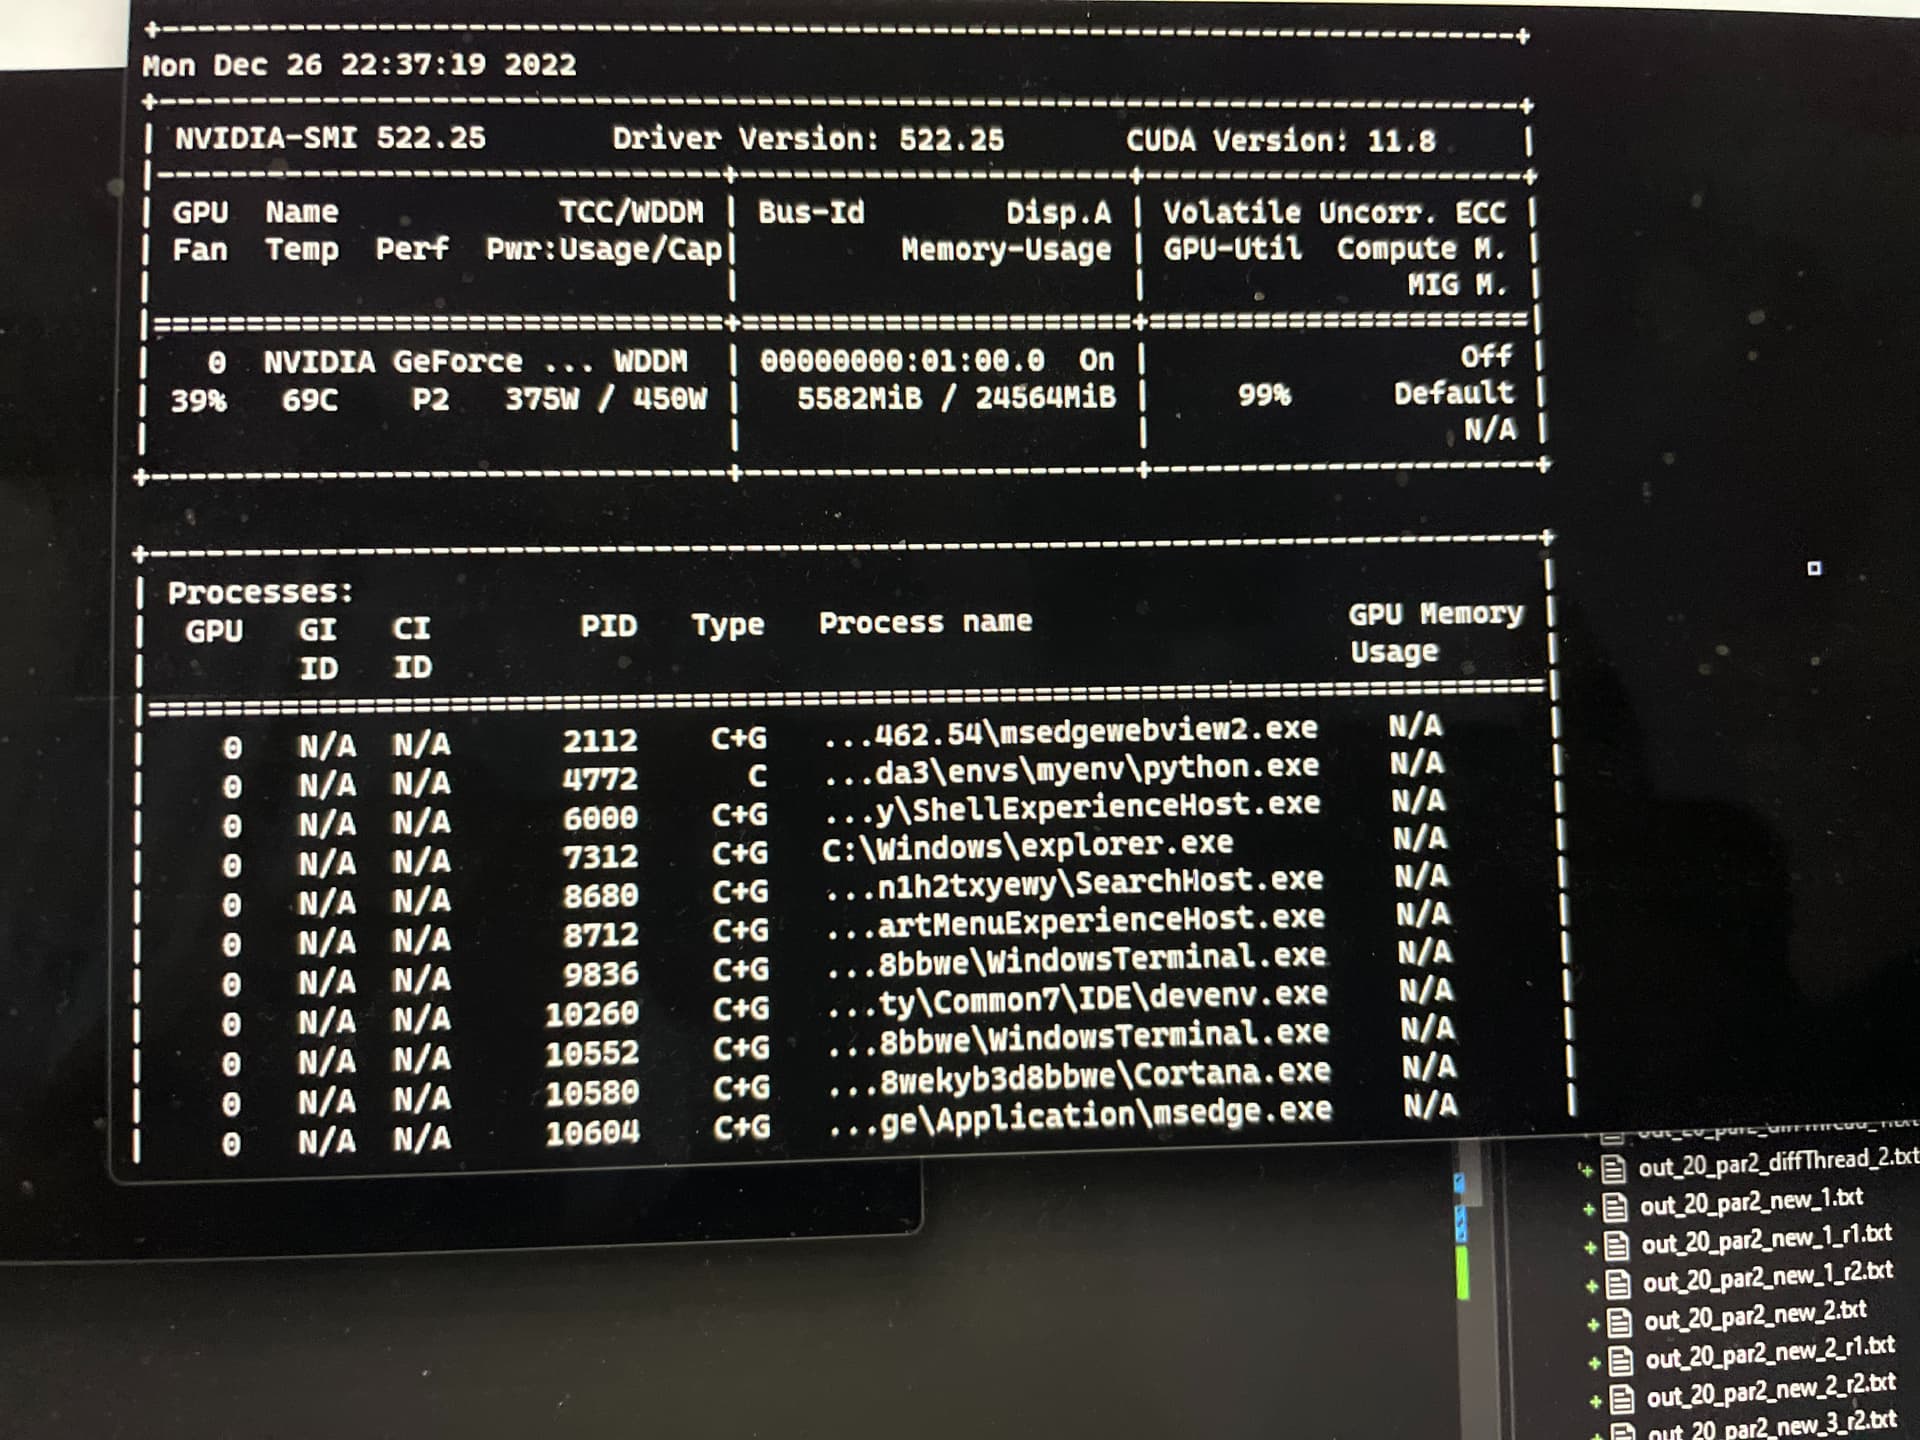
(two independent models training)
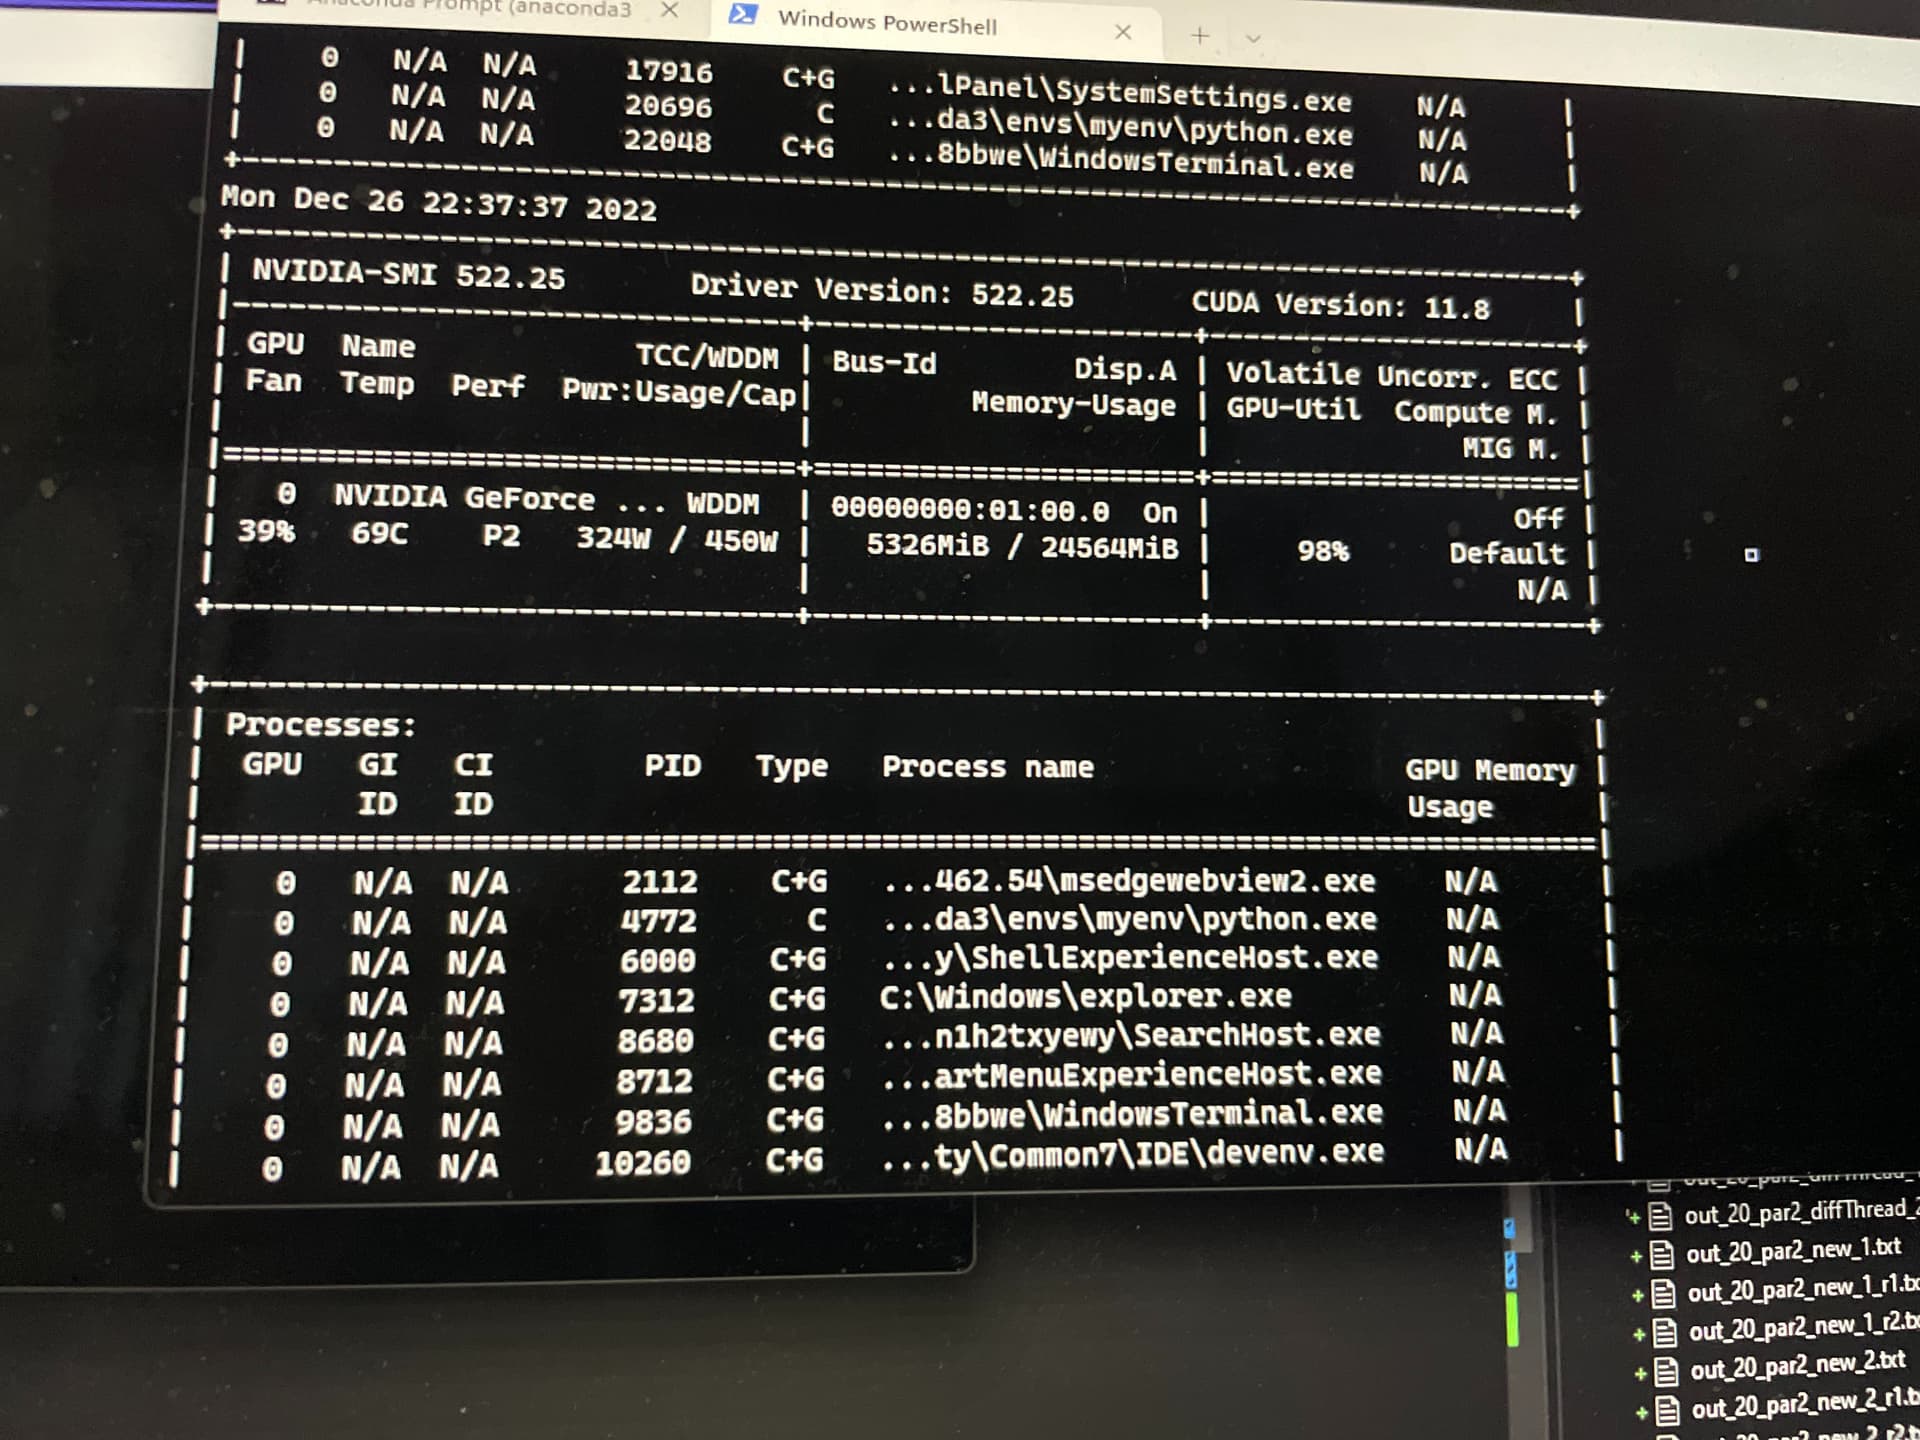
(two independent models training, another screenshot after few seconds)

(single model training)
(two independent models training)
(two independent models training, another screenshot after few seconds)
@J_Johnson , @ptrblck , Please let me know if you have any suggestions ?
99% utilization.
It means that your GPU compute cores are running at max speed. Memory is only one bottleneck. Calculation speed is the other. You’ve maxed out the latter. That’s why you’re getting a slow down on both models.
@J_Johnson , My bad (i did not realize that). I verified that with smaller network, it’s not an issue and works as expected. Thanks for your help !
1 Like
The GPU util. in nvidia-smi reports the relative time where any kernel was using the GPU over the sample period. A high util. shows that kernels are packed, but does not give you any information about the occupancy of the compute resources. You should thus profile your code, check the needed resources (sm count, registers etc.) of your kernels and make sure they can overlap.