Hey,
I’m working with this pytorch based tracker. I’m running the test script with “python3 src/test.py” and observing the fps output, which is around 20 FPS for my NVIDIA Jetson AGX Orin board. I also modified the script by adding “torch.cuda.max_memory_allocated(device)” to the end of the script to measure the maximum GPU memory allocated by this program, which seems to be around 0.43 GB for my case.
So I limited the GPU memory usage such that the new limited GPU memory would be just above my measurement of 0.43 GB with “torch.cuda.set_per_process_memory_fraction(fraction, device)”. Running this modified instance with new limit set to around 0.61 GB doesn’t affect the FPS performance as expected.
But creating multiple instances of this modified script by using a shell script affects the FPS performance such that each instances FPS measurements drop drastically.
What is the reason behind this occurrence and what is the correct way of solving it such that each limited instance can run around 20 FPS as well.
The shell script I run to launch multiple instances:
#!/bin/bash
if [ -z “$1” ]; then
echo “Usage: $0 <number_of_instances>”
exit 1
fi
NUM_INSTANCES=$1
echo “Starting $NUM_INSTANCES instances of test.py…”
for i in $(seq 1 $NUM_INSTANCES); do
python3 test.py &
echo “Started instance $i”
done
echo “All instances started. Check the system monitor to observe the effects.”
Besides the used memory each CUDA kernel will also use compute resources, which are shared between all applications. This post explains it in more details with a reference to a great GTC talk.
@ptrblck
Thanks for the quick response. I’ll check out the discussion you mentioned and will get back to you. From what you wrote, I sense that it is not a possible or a trivial task as I thought, right? 
Yes, it might not be possible if your current workload already saturates the compute resources of your GPU. In this case you won’t be able to run any other kernel in parallel as long as the GPU is busy.
@ptrblck
I see, thanks a lot for your responses. At the mean time I implemented a multi-stream, multiprocess architecture that allows me to run different CUDA streams for each process. Then I held some experiments where I launched different number of instances of the tracker I mentioned above. Since this tracker seems to be using a GPU memory of 0.43 GB, I limited it’s usage to 0.61 GB (0.01% of the current 64 GB memory that Jetson AGX Orin has). And the results are like this:
Number of Tracker Instances Launched & Average FPS
1 Instance & 18-19 FPS
5 Instance & 14-15 FPS
10 Instance & 9-10 FPS
15 Instance & 6-7 FPS
20 Instance & 4-5 FPS
Since the FPS performance decrease as the number of instances increase, I believe we can conclude that even a single instance of this tracker saturates the current GPU workload. Now I’m wondering if there is a way to observe this GPU workload numerically and then maybe limit it somehow. What do you think?
Not necessarily, since you are still seeing some speedup, so a single run might still leave the GPU idle for some time.
You could profile the workload via e.g. Nsight Systems to see how tightly packed the CUDA kernels are.
@ptrblck
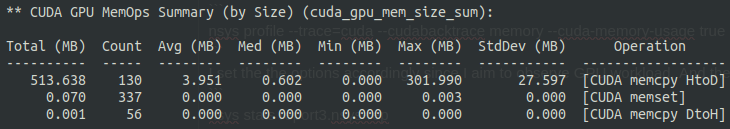
In order to profile the workload like you described, I used the nsys CLI that comes built-in with Jetpack.
nsys profile --trace=cuda --cudabacktrace memory --cuda-memory-usage true python3 stream-util.py
I set the the options accordingly since I aim to observe GPU workload. And then observing the stats with
nsys stats report3.nsys-rep
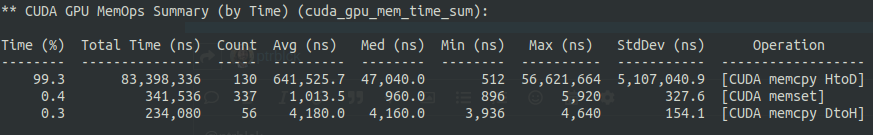
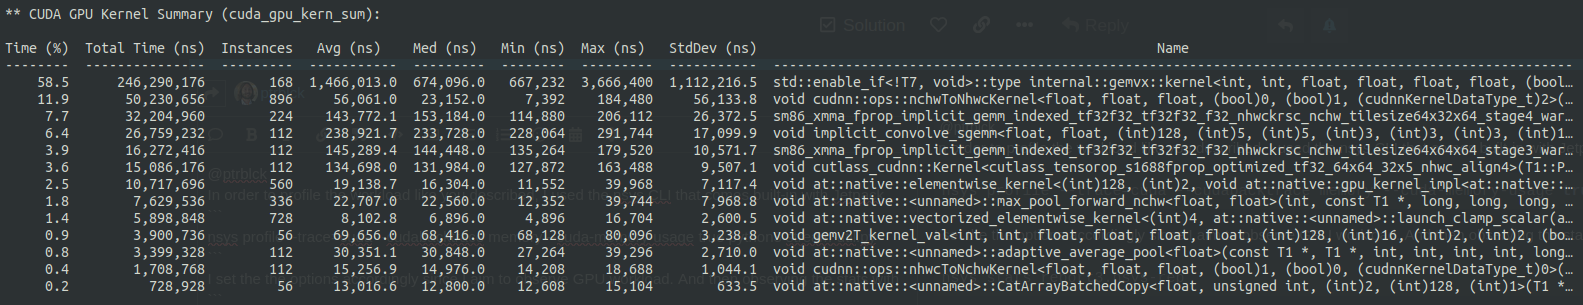
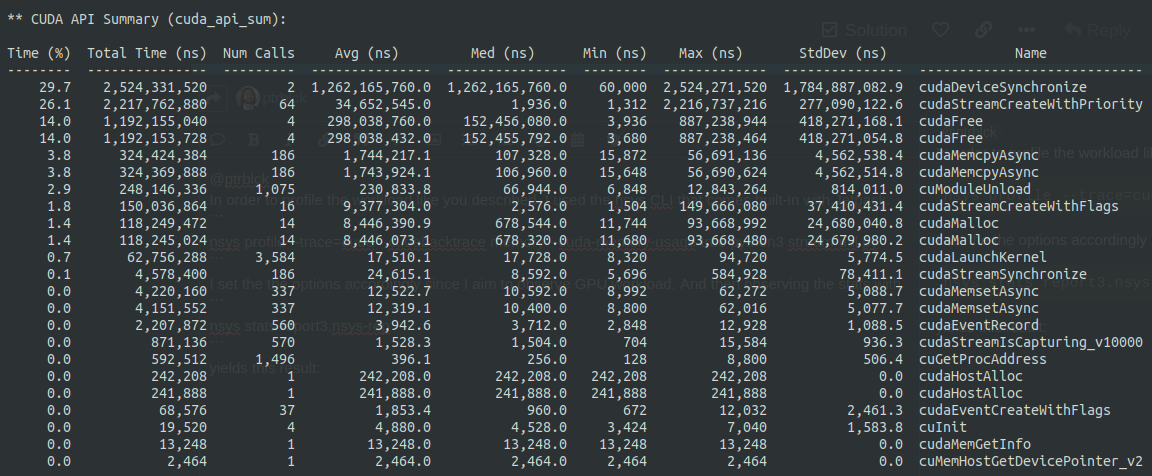
yields this result:
Since I’m new to this area I’m not sure if the method I’m applying is correct or how I should interpret this results. Can you help me with that? By the way the script I profiled is running a single instance of the tracker at the moment.
One more thing, initially I also tried setting the --gpu-metrics-device option as well, but I found that Jetson AGX Orin does not support this operation. I used this command to check capabilities.
nsys profile --trace=cuda --cudabacktrace memory --cuda-memory-usage true --gpu-metrics-device help python3 stream-util.py
And it returns:
Possible --gpu-metrics-device values are:
	0: Orin (not supported)
	all: Select all supported GPUs
	none: Disable GPU Metrics [Default]
Some GPUs are not supported. See the user guide: https://docs.nvidia.com/nsight-systems/UserGuide/index.html#gms-introduction
Thanks a lot in advance.
@ptrblck Hey again, do you have any new opinions about this case?
The summary view might not be really helpful as it does not show the IDLE times between kernels. You could open this profile in the Nsight Systems UI and check the timeline to see how tightly packed the kernels are.