I have the same issue.
Environment:
PyTorch version: 2.5.1+cu121
Is debug build: False
CUDA used to build PyTorch: 12.1
ROCM used to build PyTorch: N/A
OS: Ubuntu 24.04.2 LTS (x86_64)
GCC version: (Ubuntu 13.3.0-6ubuntu2~24.04) 13.3.0
Clang version: Could not collect
CMake version: Could not collect
Libc version: glibc-2.39
Python version: 3.12.3 (main, Jun 18 2025, 17:59:45) [GCC 13.3.0] (64-bit runtime)
Python platform: Linux-6.8.0-63-generic-x86_64-with-glibc2.39
Is CUDA available: True
CUDA runtime version: Could not collect
CUDA_MODULE_LOADING set to: LAZY
GPU models and configuration:
GPU 0: NVIDIA GeForce RTX 4090
GPU 1: NVIDIA GeForce RTX 4090
Nvidia driver version: 535.247.01
cuDNN version: Could not collect
HIP runtime version: N/A
MIOpen runtime version: N/A
Is XNNPACK available: True
CPU:
Architecture: x86_64
CPU op-mode(s): 32-bit, 64-bit
Address sizes: 39 bits physical, 48 bits virtual
Byte Order: Little Endian
CPU(s): 24
On-line CPU(s) list: 0-23
Vendor ID: GenuineIntel
Model name: Intel(R) Core™ i9-14900KF
CPU family: 6
Model: 183
Thread(s) per core: 1
Core(s) per socket: 24
Socket(s): 1
Stepping: 1
CPU(s) scaling MHz: 85%
CPU max MHz: 6000.0000
CPU min MHz: 800.0000
BogoMIPS: 6374.40
Flags: fpu vme de pse tsc msr pae mce cx8 apic sep mtrr pge mca cmov pat pse36 clflush dts acpi mmx fxsr sse sse2 ss ht tm pbe syscall nx pdpe1gb rdtscp lm constant_tsc art arch_perfmon pebs bts rep_good nopl xtopology nonstop_tsc cpuid aperfmperf tsc_known_freq pni pclmulqdq dtes64 monitor ds_cpl vmx est tm2 ssse3 sdbg fma cx16 xtpr pdcm sse4_1 sse4_2 x2apic movbe popcnt tsc_deadline_timer aes xsave avx f16c rdrand lahf_lm abm 3dnowprefetch cpuid_fault epb ssbd ibrs ibpb stibp ibrs_enhanced tpr_shadow flexpriority ept vpid ept_ad fsgsbase tsc_adjust bmi1 avx2 smep bmi2 erms invpcid rdseed adx smap clflushopt clwb intel_pt sha_ni xsaveopt xsavec xgetbv1 xsaves split_lock_detect user_shstk avx_vnni dtherm ida arat pln pts hwp hwp_notify hwp_act_window hwp_epp hwp_pkg_req hfi vnmi umip pku ospke waitpkg gfni vaes vpclmulqdq rdpid movdiri movdir64b fsrm md_clear serialize arch_lbr ibt flush_l1d arch_capabilities
Virtualization: VT-x
L1d cache: 896 KiB (24 instances)
L1i cache: 1.3 MiB (24 instances)
L2 cache: 32 MiB (12 instances)
L3 cache: 36 MiB (1 instance)
NUMA node(s): 1
NUMA node0 CPU(s): 0-23
Vulnerability Gather data sampling: Not affected
Vulnerability Itlb multihit: Not affected
Vulnerability L1tf: Not affected
Vulnerability Mds: Not affected
Vulnerability Meltdown: Not affected
Vulnerability Mmio stale data: Not affected
Vulnerability Reg file data sampling: Mitigation; Clear Register File
Vulnerability Retbleed: Not affected
Vulnerability Spec rstack overflow: Not affected
Vulnerability Spec store bypass: Mitigation; Speculative Store Bypass disabled via prctl
Vulnerability Spectre v1: Mitigation; usercopy/swapgs barriers and __user pointer sanitization
Vulnerability Spectre v2: Mitigation; Enhanced / Automatic IBRS; IBPB conditional; RSB filling; PBRSB-eIBRS SW sequence; BHI BHI_DIS_S
Vulnerability Srbds: Not affected
Vulnerability Tsx async abort: Not affected
Versions of relevant libraries:
[pip3] flake8==7.0.0
[pip3] numpy==1.26.4
[pip3] nvidia-cublas-cu12==12.1.3.1
[pip3] nvidia-cuda-cupti-cu12==12.1.105
[pip3] nvidia-cuda-nvrtc-cu12==12.1.105
[pip3] nvidia-cuda-runtime-cu12==12.1.105
[pip3] nvidia-cudnn-cu12==9.1.0.70
[pip3] nvidia-cufft-cu12==11.0.2.54
[pip3] nvidia-curand-cu12==10.3.2.106
[pip3] nvidia-cusolver-cu12==11.4.5.107
[pip3] nvidia-cusparse-cu12==12.1.0.106
[pip3] nvidia-nccl-cu12==2.21.5
[pip3] nvidia-nvjitlink-cu12==12.1.105
[pip3] nvidia-nvtx-cu12==12.1.105
[pip3] torch==2.5.1+cu121
[pip3] torchaudio==2.5.1+cu121
[pip3] torchvision==0.20.1+cu121
[pip3] triton==3.1.0
[pip3] types-flake8-2020==1.8
[pip3] types-flake8-bugbear==23.9.16
[pip3] types-flake8-builtins==2.2
[pip3] types-flake8-docstrings==1.7
[pip3] types-flake8-plugin-utils==1.3
[pip3] types-flake8-rst-docstrings==0.3
[pip3] types-flake8-simplify==0.21
[pip3] types-flake8-typing-imports==1.15
[pip3] types-mypy-extensions==1.0
[conda] Could not collectPyTorch version: 2.7.1+cu126
Is debug build: False
CUDA used to build PyTorch: 12.6
ROCM used to build PyTorch: N/A
OS: Ubuntu 24.04.2 LTS (x86_64)
GCC version: (Ubuntu 13.3.0-6ubuntu2~24.04) 13.3.0
Clang version: Could not collect
CMake version: Could not collect
Libc version: glibc-2.39
Python version: 3.12.3 (main, Jun 18 2025, 17:59:45) [GCC 13.3.0] (64-bit runtime)
Python platform: Linux-6.8.0-63-generic-x86_64-with-glibc2.39
Is CUDA available: True
CUDA runtime version: Could not collect
CUDA_MODULE_LOADING set to: LAZY
GPU models and configuration:
GPU 0: NVIDIA GeForce RTX 4090
GPU 1: NVIDIA GeForce RTX 4090
Nvidia driver version: 535.247.01
cuDNN version: Could not collect
HIP runtime version: N/A
MIOpen runtime version: N/A
Is XNNPACK available: True
CPU:
Architecture: x86_64
CPU op-mode(s): 32-bit, 64-bit
Address sizes: 39 bits physical, 48 bits virtual
Byte Order: Little Endian
CPU(s): 24
On-line CPU(s) list: 0-23
Vendor ID: GenuineIntel
Model name: Intel(R) Core™ i9-14900KF
CPU family: 6
Model: 183
Thread(s) per core: 1
Core(s) per socket: 24
Socket(s): 1
Stepping: 1
CPU(s) scaling MHz: 70%
CPU max MHz: 6000.0000
CPU min MHz: 800.0000
BogoMIPS: 6374.40
Flags: fpu vme de pse tsc msr pae mce cx8 apic sep mtrr pge mca cmov pat pse36 clflush dts acpi mmx fxsr sse sse2 ss ht tm pbe syscall nx pdpe1gb rdtscp lm constant_tsc art arch_perfmon pebs bts rep_good nopl xtopology nonstop_tsc cpuid aperfmperf tsc_known_freq pni pclmulqdq dtes64 monitor ds_cpl vmx est tm2 ssse3 sdbg fma cx16 xtpr pdcm sse4_1 sse4_2 x2apic movbe popcnt tsc_deadline_timer aes xsave avx f16c rdrand lahf_lm abm 3dnowprefetch cpuid_fault epb ssbd ibrs ibpb stibp ibrs_enhanced tpr_shadow flexpriority ept vpid ept_ad fsgsbase tsc_adjust bmi1 avx2 smep bmi2 erms invpcid rdseed adx smap clflushopt clwb intel_pt sha_ni xsaveopt xsavec xgetbv1 xsaves split_lock_detect user_shstk avx_vnni dtherm ida arat pln pts hwp hwp_notify hwp_act_window hwp_epp hwp_pkg_req hfi vnmi umip pku ospke waitpkg gfni vaes vpclmulqdq rdpid movdiri movdir64b fsrm md_clear serialize arch_lbr ibt flush_l1d arch_capabilities
Virtualization: VT-x
L1d cache: 896 KiB (24 instances)
L1i cache: 1.3 MiB (24 instances)
L2 cache: 32 MiB (12 instances)
L3 cache: 36 MiB (1 instance)
NUMA node(s): 1
NUMA node0 CPU(s): 0-23
Vulnerability Gather data sampling: Not affected
Vulnerability Itlb multihit: Not affected
Vulnerability L1tf: Not affected
Vulnerability Mds: Not affected
Vulnerability Meltdown: Not affected
Vulnerability Mmio stale data: Not affected
Vulnerability Reg file data sampling: Mitigation; Clear Register File
Vulnerability Retbleed: Not affected
Vulnerability Spec rstack overflow: Not affected
Vulnerability Spec store bypass: Mitigation; Speculative Store Bypass disabled via prctl
Vulnerability Spectre v1: Mitigation; usercopy/swapgs barriers and __user pointer sanitization
Vulnerability Spectre v2: Mitigation; Enhanced / Automatic IBRS; IBPB conditional; RSB filling; PBRSB-eIBRS SW sequence; BHI BHI_DIS_S
Vulnerability Srbds: Not affected
Vulnerability Tsx async abort: Not affected
Versions of relevant libraries:
[pip3] numpy==2.3.1
[pip3] nvidia-cublas-cu12==12.6.4.1
[pip3] nvidia-cuda-cupti-cu12==12.6.80
[pip3] nvidia-cuda-nvrtc-cu12==12.6.77
[pip3] nvidia-cuda-runtime-cu12==12.6.77
[pip3] nvidia-cudnn-cu12==9.5.1.17
[pip3] nvidia-cufft-cu12==11.3.0.4
[pip3] nvidia-curand-cu12==10.3.7.77
[pip3] nvidia-cusolver-cu12==11.7.1.2
[pip3] nvidia-cusparse-cu12==12.5.4.2
[pip3] nvidia-cusparselt-cu12==0.6.3
[pip3] nvidia-nccl-cu12==2.26.2
[pip3] nvidia-nvjitlink-cu12==12.6.85
[pip3] nvidia-nvtx-cu12==12.6.77
[pip3] torch==2.7.1
[pip3] torcheval==0.0.7
[pip3] torchvision==0.22.1
[pip3] triton==3.3.1
[conda] Could not collect
Actually, after several trials, I suspect the problem is due to a failure in synchronization due to the Triton generated kernels. My guess comes from a bunch of errors raised other than the usual “segmentation fault (core dumped)” one.
I’m providing you with a some of these error essential lines and my (possibly wrong) explanation in the hope that they can be of help.
...
E0620 15:26:01.373000 75212 torch/_inductor/runtime/triton_heuristics.py:539
RuntimeError: PassManager::run failed
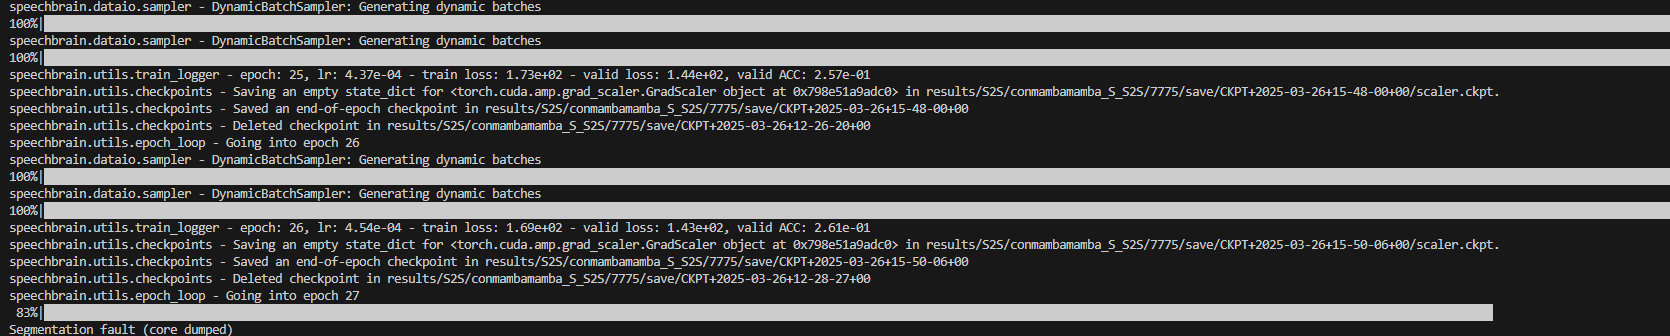
Segmentation fault (core dumped)
This is a Triton (Inductor kernel) compilation crash during a fused group_norm + backward operation.
free(): corrupted unsorted chunks
malloc(): unsorted double linked list corrupted
gcc: internal compiler error: Aborted signal terminated program cc1
Please submit a full bug report, with preprocessed source (by using -freport-bug).
See <file:///usr/share/doc/gcc-13/README.Bugs> for instructions.
...
torch._inductor.exc.InductorError: CalledProcessError: Command '['/usr/bin/gcc', '/tmp/tmpogrgxzqp/main.c', '-O3', '-shared', '-fPIC', '-Wno-psabi', '-o', '/tmp/tmpogrgxzqp/__triton_launcher.cpython-312-x86_64-linux-gnu.so', '-lcuda', '-L/home/poire/fresh_env/lib/python3.12/site-packages/triton/backends/nvidia/lib', '-L/lib/x86_64-linux-gnu', '-I/home/poire/fresh_env/lib/python3.12/site-packages/triton/backends/nvidia/include', '-I/tmp/tmpogrgxzqp', '-I/usr/include/python3.12']' returned non-zero exit status 4.
This error looks to show a failure inside the compiler itself—GCC detected heap corruption while trying to compile Triton-generated kernels and aborted.
warnings.warn(
exception calling callback for <Future at 0x75df909c3a70 state=finished returned bytes>
Traceback (most recent call last):
  File "/usr/lib/python3.12/concurrent/futures/_base.py", line 340, in _invoke_callbacks
    callback(self)
  File "/home/poire/fresh_env/lib/python3.12/site-packages/torch/_inductor/compile_worker/subproc_pool.py", line 326, in callback
    _send_msg(self.write_pipe, job_id, result)
  File "/home/poire/fresh_env/lib/python3.12/site-packages/torch/_inductor/compile_worker/subproc_pool.py", line 50, in _send_msg
    write_pipe.write(job_data)
BrokenPipeError: [Errno 32] Broken pipe
Segmentation fault (core dumped)
Here, it looks like the failure is coming from the Inductor’s asynchronous compile workers crashing mid-flight—when a worker process segfaults, its parent tries to write back the compiled kernel bytes over a pipe and finds the other end gone, hence the BrokenPipeError.
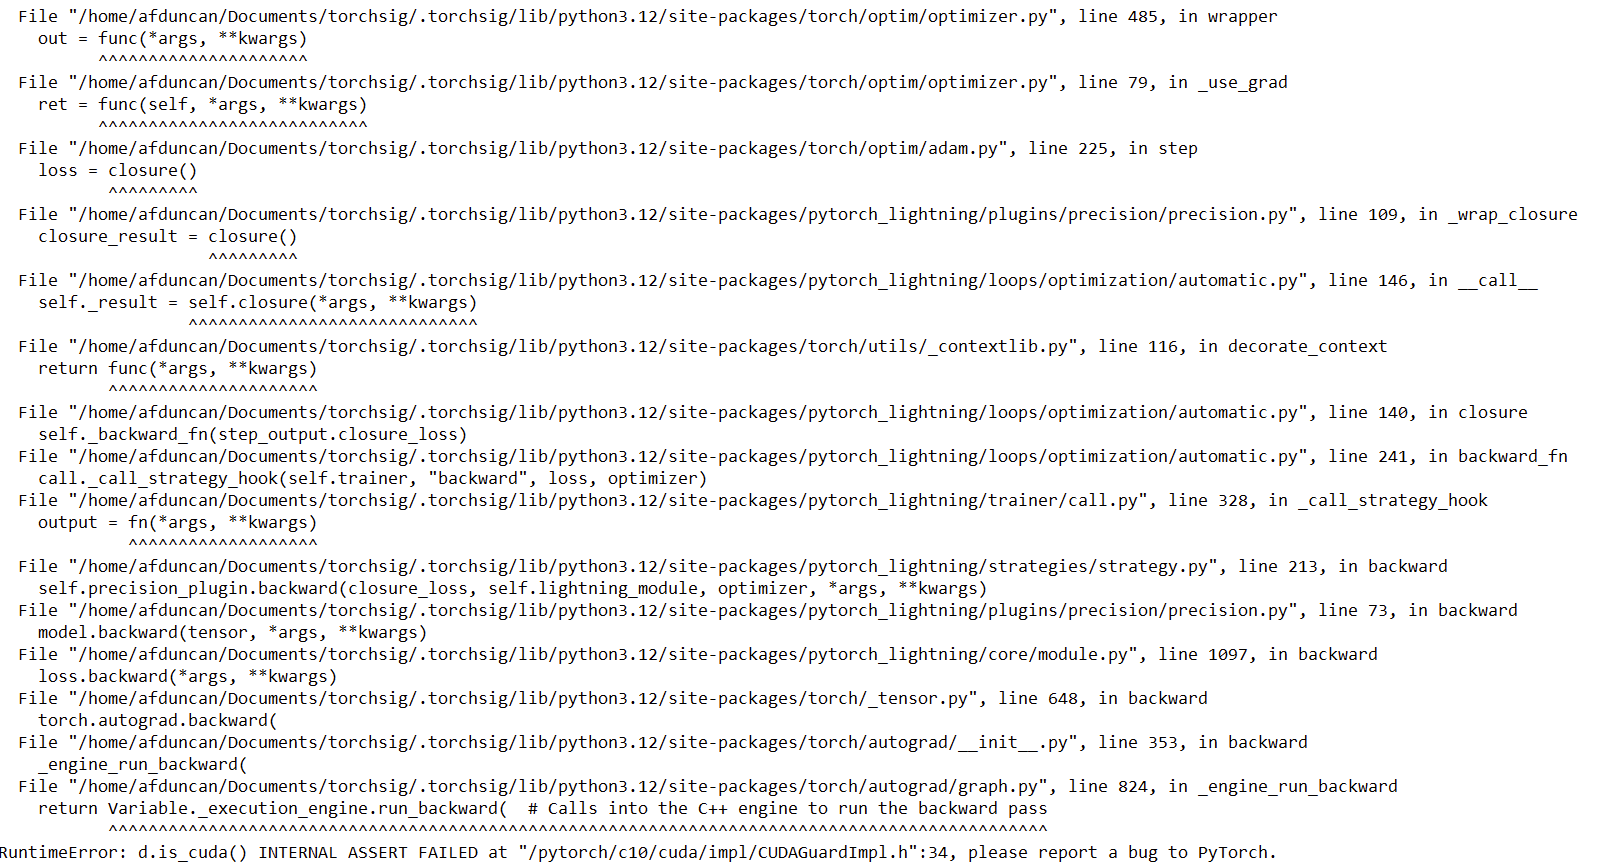
I don’t know if there can be any relationship because of the fx graph generation, but I get the same “segmentation fault (core dumped)” error when performing quantization using Pytorch 2 Export Quantization mode. The following is the error I got when assessing the accuracy of the quantized model:
RuntimeError: CUDA error: misaligned address
CUDA kernel errors might be asynchronously reported at some other API call, so the stacktrace below might be incorrect.
For debugging consider passing CUDA_LAUNCH_BLOCKING=1
Compile with TORCH_USE_CUDA_DSA to enable device-side assertions.
A workaround I am applying to reduce the error raising is to use print() functions and setting the drop_last dataloader argument to True. This, in theory, should do the same thing under the hood:
1- print() functions force synchronization between Triton’s asynchronous kernel compile & your model’s execution,
2- drop_last eliminates the dynamic‐shape edge case of a smaller “last” batch (which would trigger a second, differently‑shaped specialization).