Current memory use 2.6GiB of 7.7 GiB as seen on Ubuntu System Monitor
a = torch.tensor(1).cuda(0)
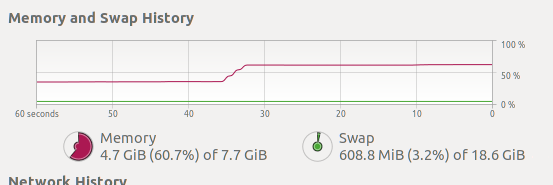
After running the command above memory use jumps to 4.7GiB
I’m not able to release this memory other than restarting the kernel. Tried del a, working on cuda in a function and torch.cuda.empty_cuda() but these do not work.
This only happens the first time I send tensor to cuda. To me this use of memory is ironic as I’m working on GPU and it limits how much I can send to cuda as the RAM committed does grow when batch sizes grow.
Working with tensor on .cpu() has none of these memory commitment issues.
My questions are:
Why is so much memory being committed when sending tensor with single INT tensor to GPU?
How can I release this memory again without killing the kernel?
Sending a tensor to the GPU should not allocate that much system RAM.
Could you post some information about your setup?
I.e. which GPU are you using as well as PyTorch version, how you’ve installed it (built from source or binaries), as well as the local CUDA and cudnn versions, if installed.
I suspect some just-in-time compilation might be going on in the background.
How long does this command take when you first run it?
Linux-x86_64
NVidia Driver 430.64
GeForce RTX 2070
torchvision 0.3.0 py37_cu10.0.130_1 pytorch installed with conda as part of fastai install.
Cuda compilation tools, release 10.1, V10.1.105
Having trouble verifying version of CudNN
I was able to get 1.3.1 on jupyter notebook and 1.4.1 to work with python3 in terminal with different conda environments.
The memory still goes up from 2.7 to 4.7GiB after running the code
I’ve managed to install perf top, but am not sure how to check for ptx calls.
On running it I can see libcuda.so.430.64 dominating with 15% overhead when I run the .cuda(0) command for the first time