Separate data points into two categories

Hallo everyone.

Newbie here, trying to learn.
I have some data points on the (x,y) field that are supposed to be cotegorised into two categories denoted here with X and O like this

import numpy as np
import matplotlib.pyplot as plt
x1 = np.array([0.1,0.3,0.1,0.6,0.4,0.6,0.5,0.9,0.4,0.7])
x2 = np.array([0.1,0.4,0.5,0.9,0.2,0.3,0.6,0.2,0.4,0.6])
c=np.array([ 1,1,1,1,1,0,0,0,0,0 ])
plt.plot(x1[c==0], x2[c==0], 'bo')
plt.plot(x1[c==1], x2[c==1], 'rx')

Now I want to find a way so I can find the “best fitting curve” separating those like this
Screenshot at 2020-11-13 00-30-00

First I though maybe I try nearest neighbor method but I’ve been told it cannot apply here and that there’s a much simpler way to do it with an ANN but I can’t understand how.
Any ideas on what to use and/or how to do it?

Thank you everyone in advance!

That’s a pretty general question and I would recommend to take a look at some general machine learning use cases. If you’ve never worked with ANNs before, take a look at some courses or lectures, such as fast.ai or any tutorials you can find online.
Although I think the PyTorch tutorials are useful, I think they might not be the best introduction to ML in general, since they focus more on the usage of the PyTorch framework.

@ptrblck an you recommend some use cases? Can you help with what I’ve asked?

Do you mean what courses I would recommend?

Sure, you can try with a simple 1-layer NN and overfit it on the dataset. Since you seem to be dealing with only 10 samples, this shouldn’t be too hard.
I’m skeptical if posting the code really helps in solving this example and would still recommend to take a look at a course.

I’m currently taking the course from coursera Deep Neural Networks with PyTorch , however the practial approach is a little bit short. It’s only good for the theoretical part

OK, cool. That’s probably a good starter. In that case, take a look at e.g .this tutorial where you will learn more about how to create models.

My problem with this specific example is that the curve produced here is not real mathematical funcion thus I don’t think that it can be approximated with a logistic regression. Am I right?

If you cannot plot the curve directly, an often used approach is to feed a meshgrid into the classifier and use the predictions to create the boundaries as described here.

Hallo again.
I studied your tutoril. I can say it’s helpful enough.
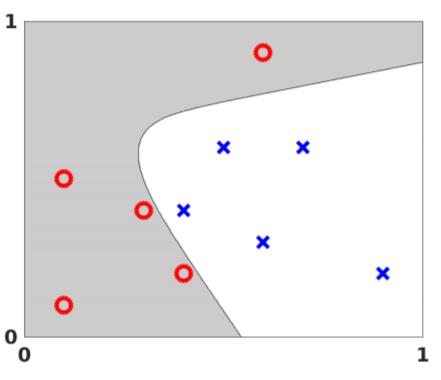
I made think I have make some progress with my problem.
Here’s my model I built, I have a NN with 2 hidden layers and I want to use the sigmoid for my prediction. I have created the dataset with the points and the class 0 or 1 but I have come to a dead end.
Can you help please help me? Whats wrong? I can’t understand why the AttributeError: ‘data’ object has no attribute ‘len’ come on.
Also do you think that my code is close enough to the solution or I have messed up? Thank you in advance!

import torch
import numpy as np
import matplotlib.pyplot as plt 
import torch.nn as nn
import torch.nn.functional as F
from torch.utils.data import Dataset, DataLoader

class data():   
    def __init__(self):
        x=np.array([[0.1,0.1], [0.3,0.4] , [0.1,0.5] , [0.6,0.9] , [0.4,0.2] , [0.6,0.3] , [0.5,0.6] , [0.9,0.2] , [0.4,0.4] ,[0.7,0.6]])
        y=np.array([1,1,1,1,1,0,0,0,0,0])
        self.y = torch.from_numpy(y).type(torch.LongTensor)
        self.x = torch.from_numpy(x).type(torch.FloatTensor)

    def __getitem__(self, index):    
        return self.x[index], self.y[index]
    def __len__(self):
        return self.len

class Net(nn.Module):
	def __init__(self, D_in=2, H1=2, H2=3, D_out=2):
		super(Net, self).__init__()
		self.linear1 = nn.Linear(D_in, H1)
		self.linear2 = nn.Linear(H1, H2)
		self.linear3 = nn.Linear(H2, D_out)
	    # Prediction
	def forward(self, x):
		x = torch.sigmoid(self.linear1(x))
		x = torch.sigmoid(self.linear2(x))
		x = torch.sigmoid(self.linear3(x))
		return x
		
def train(data_set, model, criterion, train_loader, optimizer, epochs=100):
    LOSS = []
    ACC = []
    for epoch in range(epochs):
        for x, y in train_loader:
            optimizer.zero_grad()
            yhat = model(x)
            loss = criterion(yhat, y)
            optimizer.zero_grad()
            loss.backward()
            optimizer.step()
            LOSS.append(loss.item())
        ACC.append(accuracy(model, data_set)) 
    return LOSS

data_set=data()
model = Net()
learning_rate = 0.10
optimizer = torch.optim.SGD(model.parameters() ,lr=learning_rate)
train_loader = DataLoader(dataset=data_set, batch_size=1)
criterion = nn.MSELoss()
LOSS = train(data_set, model, criterion, train_loader, optimizer, epochs=100)
print('arrived here')