I was able to run semantic segmentation on the below image.The problem is given all pixels belonging to the sky category I need to set them to white
.
For this my approach is as follows
- obtain semantic map output
- then find all pixels belonging to the sky class[which in this case have their color value set to 6,230,230]
- And then set them all to 255.
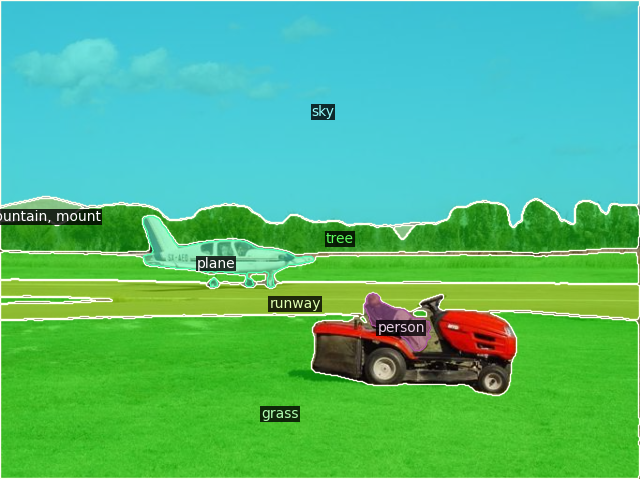
The original image

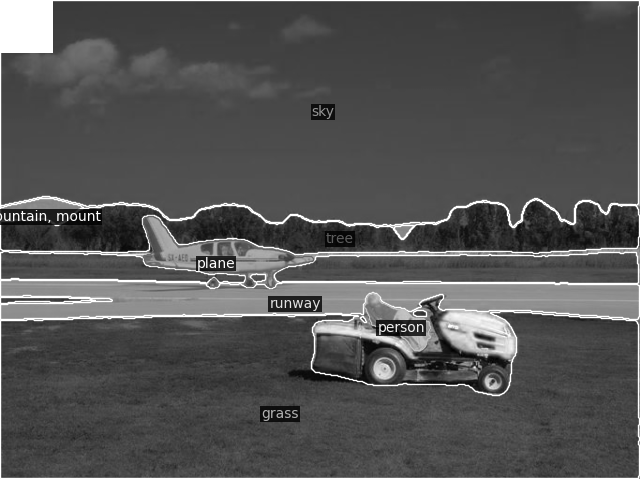
And its semantic map output is as follows
This is what i have tried
indice_r=np.where(image[:,:,0]==6)
indice_g=np.where(image[:,:,1]==230)
indice_b=np.where(image[:,:,2]==230)
#Set the pixel value for those found indices(here we are performing this across B ) to 0
#The same step is done twice for R and G respectively
for i in range(len(indice_b[0])):
  for j in range(len(indice_b[1])):
    new_img[i,j,2]=255
Unfortunately this approach didn’t work as it only made a small section on the top left white
So i was wondering is this really the right approach and how can I generalize this to handle any class rather than sky.For example what if we want to set the pixels belonging to the person to white.
Note in all images the sky class has been color coded as [6,230,230 This is the standard choice of the semantic pallete chosen in the ADE dataset.
Another approach is to use bitwise_and to select the blue regions in the semantic map and then subtract that from the original image.However that requires a lower and upper range which may differ from image to image.
In case it’s not clear why my first approach to setting pixels to white isn’t working.
this is the result for the first approach
So i tried using the bitwise idea.
Here i converted the image to hsv to get a better understanding of which pixels are set to blue or light blue
The HSV plot is shown below
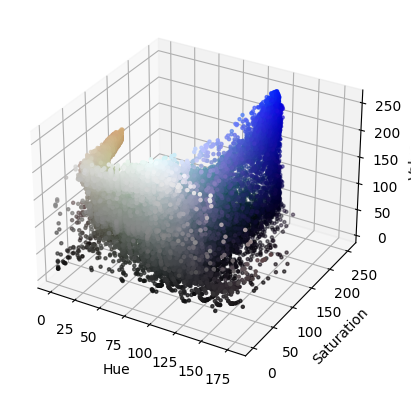
from this i think the light blue lower and upper ranges are
(77,90,0) and (125,250,225)
Using this i created the bitwise mask and obtained this beauty
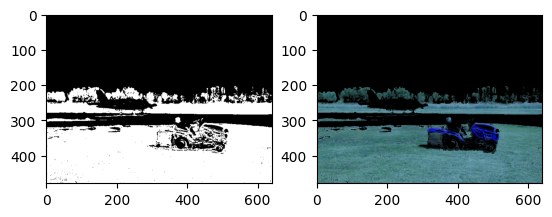
Code for masking
mask = cv2.inRange(hsv_img, light_b, high_b)
result = cv2.bitwise_and(img, img, mask=mask)
plt.subplot(1, 2, 1)
plt.imshow(mask, cmap="gray")
plt.subplot(1, 2, 2)
plt.imshow(result)
plt.show()
Not sure why the sky is jet black here.
Would appreciate it if some kind soul could help me