Hi. I am trying to compare the original image, the ground truth mask and the predicted mask by displaying them. However, I am entirely new to this and I would like to ask for anyone’s opinion if am I doing it right. Here is my prediction script:
def test(model):
  model.eval
  correct = 0
  total = 0

  with torch.no_grad():
      for i in tqdm(range(len(img_test))):


          real_class = mask_test[i]
          net_out = model(img_test[i].view(-1, 3, 448, 448))[0]
          _,predicted_class = torch.max(net_out, 0)

          prediction = predicted_class.eq(mask_test[i])


          plt.figure(figsize=(22,8))
          plt.subplot(1, 3, 1)
          plt.imshow(real_class.detach().cpu().squeeze())
          plt.title('original mask')

          plt.subplot(1, 3, 2)
          plt.imshow(prediction.detach().cpu().squeeze())
          plt.title('predicted mask')

          plt.subplot(1, 3, 3)
          plt.imshow(img_test[i].view(-1, 448, 448, 3).detach().cpu().squeeze())
          plt.title('original image')

          break


test(model)
I am asking this because the ground truth and my predicted mask is almost identical, I fear it was just inverting colors.
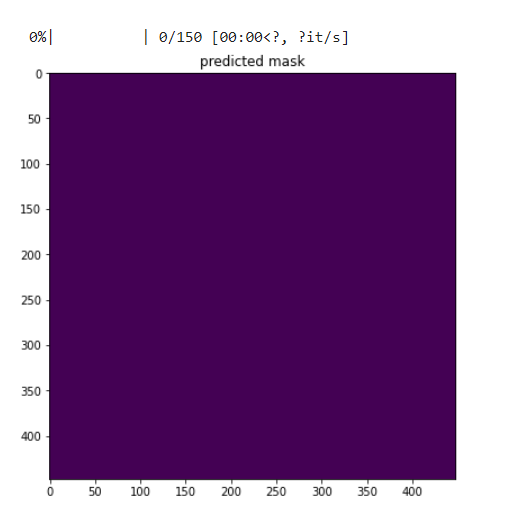
by the way this are my results
The center image (predicted mask) shows that background is correctly segmented but the two objects are not since that part is equal to 0. Can you try plotting predicted_class directly ?
Hi! Thank you for replying. I dont understand why can you say that the two objects are not segmented correctly? is it because of the color?
Yes. I think the default cmap is viridis and when I print the values for 0 and 255 (note that pyplot rescales the array to have max become 255 and min become 0) I get
viridis = plt.cm.get_cmap('viridis', 12)
print(viridis(0), viridis(255))
(0.267004, 0.004874, 0.329415, 1.0) (0.993248, 0.906157, 0.143936, 1.0)
So, yellow is 255 and purple is 0, which could mean the purple part is wrongly segmented.
Thank you for your help. Can you help me pinpoint where I might did something wrong for the objects inside be wrongly segmented?
Can you plot the predicted_class using
plt.subplot(1, 3, 2)
plt.imshow(predicted_class.detach().cpu().squeeze())
plt.title('predicted mask')
I am saddened by this!
can you please help me figure out my mistake?
Hmmm…looks like the model has predicted everything as background. What kind of dice scores were you getting during training?
For a detailed explanation on the project I am working I am goin to put all the details. I am currently working to develop a model that can hopefully take an RGB image containing garbage and outputs a segmented image (i am hoping to segment it according to the 60 categories I defined). I used Adam as the optimizer and cross-entropy as the loss_function. During training, (I tried 10 epoch at most), the lowest loss value I got was 0.14. This is my training script:
BATCH_SIZE = 4
EPOCHS = 3

def train(model):
  model.train()
  for epoch in range(EPOCHS):
      for i in tqdm(range(0, len(img_train), BATCH_SIZE)):
          batch_img_train = img_train[i:i+BATCH_SIZE].view(-1, 3, 448, 448)
          batch_mask_train = mask_train[i:i+BATCH_SIZE].view(-1, 1, 448, 448)

          model.zero_grad()

          outputs = model(batch_img_train)

          loss = loss_function(outputs, batch_mask_train.squeeze(1).long())
          loss.backward()
          optimizer.step()    # Does the update

      print(f"Epoch: {epoch}. Loss: {loss}")

  return batch_img_train, batch_mask_train, outputs

train(model)
Hmmm, although the loss may seem small, but since the background class much more abundant, the model might have got away with predicting every pixel as background. Can you try using dice as both loss and as a metric ? Also, is the loss around 0.14 for validation too ?
I may sound so dumb but I don’t understand what you with “using dice as both loss and as a metric”. Can you please help me understand that?
There is something called dice loss (which is quite similar to F1-score but can also be soft to be differentiable) which is used regularly in semantic segmentation tasks. The dice score (or F1-score) can then also be used as a metric to evaluate one’s model on the validation set.
Thank your for your response. I’ve read about the problem that I currently have and according to the articles I’ve read, my network might have what they call “class imbalance”. The images in my dataset mostly contain small garbage only. How can I solve this kind of problem?
Dice loss should help I think. If not you can try to ‘oversample’ by selecting patches of the ‘small garbage’ more often.
is dice loss the same with what they call IoU? and how do I oversample?
It is slightly different, while dice score (hard) is
2 * TP / (2 * TP + FP +FN)
IOU is
TP / (TP + FP + FN)
What part of my code should I implement dice?
You can replace loss_function with cross_entropy plus dice loss.
My loss function is already cross entropy. How do I incorporate dice loss with it?