Given some m-by-m covariance matrix C with missing entries, I would like to find a low rank m-by-k matrix L where k << m so that LL^T is a good approximation to C. To do so, I’ve coded a distributed version of stochastic gradient descent using Pytorch’s distributed framework.
I noticed that for a fixed number of observed points in C there is a dramatic increase in the time reqired complete a backward pass after m exceeds some threshold. I profiled my code and realized that after m reaches this threshold, the CPU time avg for calls to aten::fill_ and aten::add_ during the backward pass spike then plateau. Below is a minimum working example demonstrating this behavior.
# mwe.py
import argparse
import os
import torch
import torch.distributed as dist
import torch.multiprocessing as mp
import torch.nn as nn
from torch.nn.functional import mse_loss
from typing import Callable


class LowRankCovariance(nn.Module):

    def __init__(
            self,
            num_vars: int,
            num_facs: int
        ):
        super().__init__()
        self.num_facs = num_facs
        self.loads = torch.randn(num_vars, num_facs, dtype=torch.float64)
        self.loads.requires_grad_()
        self.loads = nn.Parameter(self.loads)

    def forward(self, idx0, idx1):
        return (self.loads[idx0] * self.loads[idx1]).sum(dim=1)


def init_process(
        rank: int,
        world_size: int,
        fcn: Callable,
        path_shared: str,
        num_vars: int,
        num_facs: int,
        batch_size: int,
        lr: float,
        seed: int
    ):
    dist.init_process_group(
        'gloo', init_method=f'file://{path_shared}',
        rank=rank, world_size=world_size
    )
    fcn(rank, num_vars, num_facs, batch_size, lr, seed)


def train(
        rank: int,
        num_vars: int,
        num_facs: int,
        batch_size: int,
        lr: float,
        seed: int
    ) -> None:

    gen = torch.Generator().manual_seed(seed)

    # Generate fake data
    sz = 10000
    points1 = torch.randint(0, num_vars, (sz,), dtype=torch.int32, generator=gen)
    points2 = torch.randint(0, num_vars, (sz,), dtype=torch.int32, generator=gen)
    points = torch.column_stack([points1, points2])
    cov = torch.randn(sz, dtype=torch.float64, generator=gen)

    model = LowRankCovariance(num_vars, num_facs)
    optimizer = torch.optim.SGD(model.parameters(), lr=lr)

    with torch.autograd.profiler.profile(enabled=True) as prof:

        cnt = 0
        while cnt < sz:

            # Get batch of data
            last_idx = min(cnt, cnt + batch_size)
            points_batch = points[cnt:last_idx]
            cov_batch = cov[cnt:last_idx]
            cnt += batch_size

            # Forward pass
            preds = model(points_batch[:,0], points_batch[:,1])
            loss = mse_loss(preds, cov_batch)

            # Backward pass
            optimizer.zero_grad()
            with torch.autograd.profiler.record_function('backward_pass'):
                loss.backward()
            optimizer.step()

    if rank == 0:
        script_dir = os.path.dirname(os.path.realpath(__file__))
        prof.export_chrome_trace(f'{script_dir}/profile_{num_vars}.json')
        print(prof.key_averages().table(sort_by="self_cpu_time_total"))

    dist.destroy_process_group()


if __name__ == '__main__':

    parser = argparse.ArgumentParser()
    parser.add_argument('--num_vars', type=int)
    parser.add_argument('--world_size', type=int)
    parser.add_argument('--num_facs', type=int)
    parser.add_argument('--batch_size', type=int)
    parser.add_argument('--lr', type=float)
    parser.add_argument('--seed', type=int, default=12345)
    args = parser.parse_args()


    # ---------- DISTRIBUTED TRAINING ---------- #

    # Refresh file for shared file-system initialization
    script_dir = os.path.dirname(os.path.realpath(__file__))
    path_shared = os.path.join(script_dir, 'shared')
    if os.path.exists(path_shared):
        os.remove(path_shared)

    mp.set_start_method('spawn')
    processes = []
    for rank in range(args.world_size):
        p = mp.Process(
            target=init_process,
            args=(
                rank, args.world_size, train, path_shared,
                args.num_vars, args.num_facs, args.batch_size,
                args.lr, args.seed + rank
            )
        )
        p.start()
        processes.append(p)

    for p in processes:
        p.join()
If you run the script five times (see commands below) with m = 8190, 8191, 8192, 8193, and 8194, you’ll notice that the average CPU times for aten::fill_ and aten:add_ start low, increase slightly at m = 8192 then increase dramatically at m = 8193 and remain high.
$ python mwe.py --num_vars 8190 --world_size 5 --num_facs 4 --batch_size 512 --lr 0.1
$ python mwe.py --num_vars 8191 --world_size 5 --num_facs 4 --batch_size 512 --lr 0.1
$ python mwe.py --num_vars 8192 --world_size 5 --num_facs 4 --batch_size 512 --lr 0.1
$ python mwe.py --num_vars 8193 --world_size 5 --num_facs 4 --batch_size 512 --lr 0.1
$ python mwe.py --num_vars 8194 --world_size 5 --num_facs 4 --batch_size 512 --lr 0.1
Below are two screenshots of profile traces for m = 8191 and m = 8193.
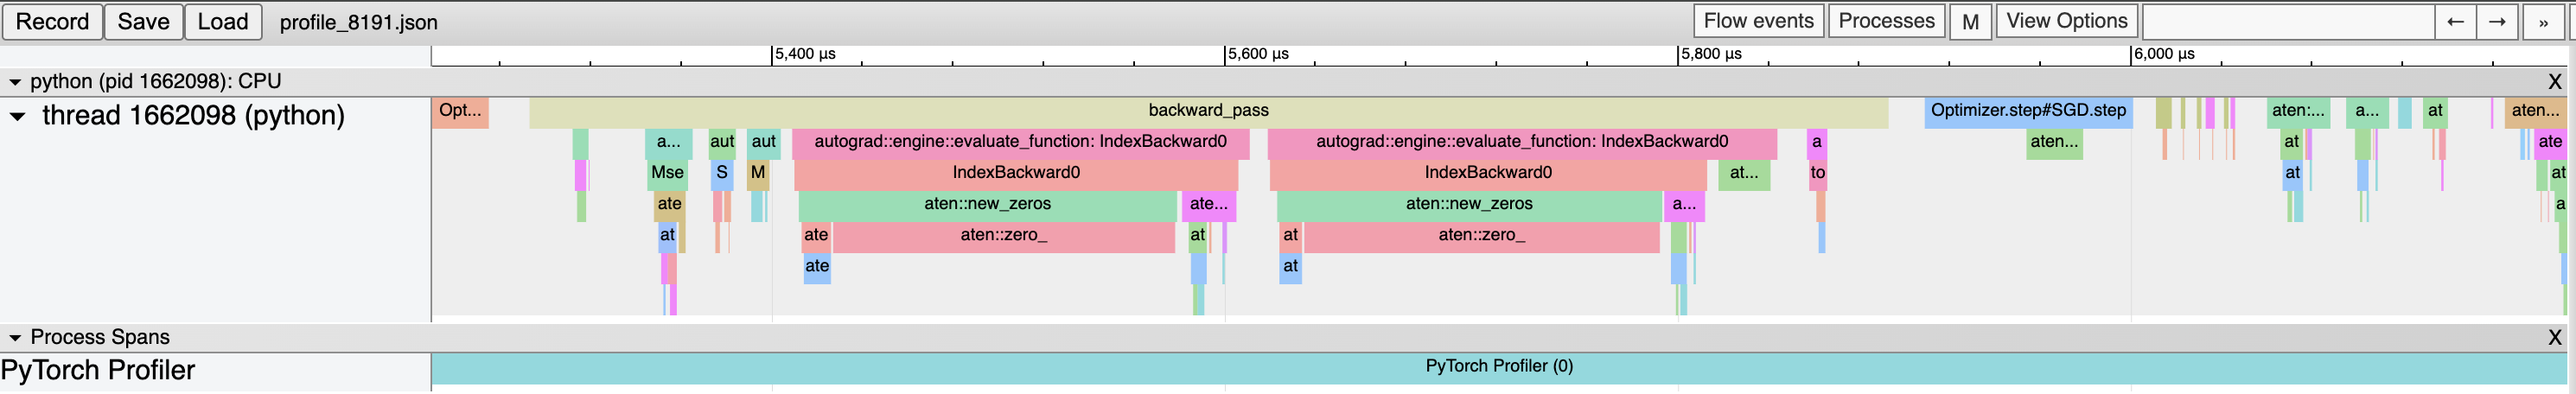
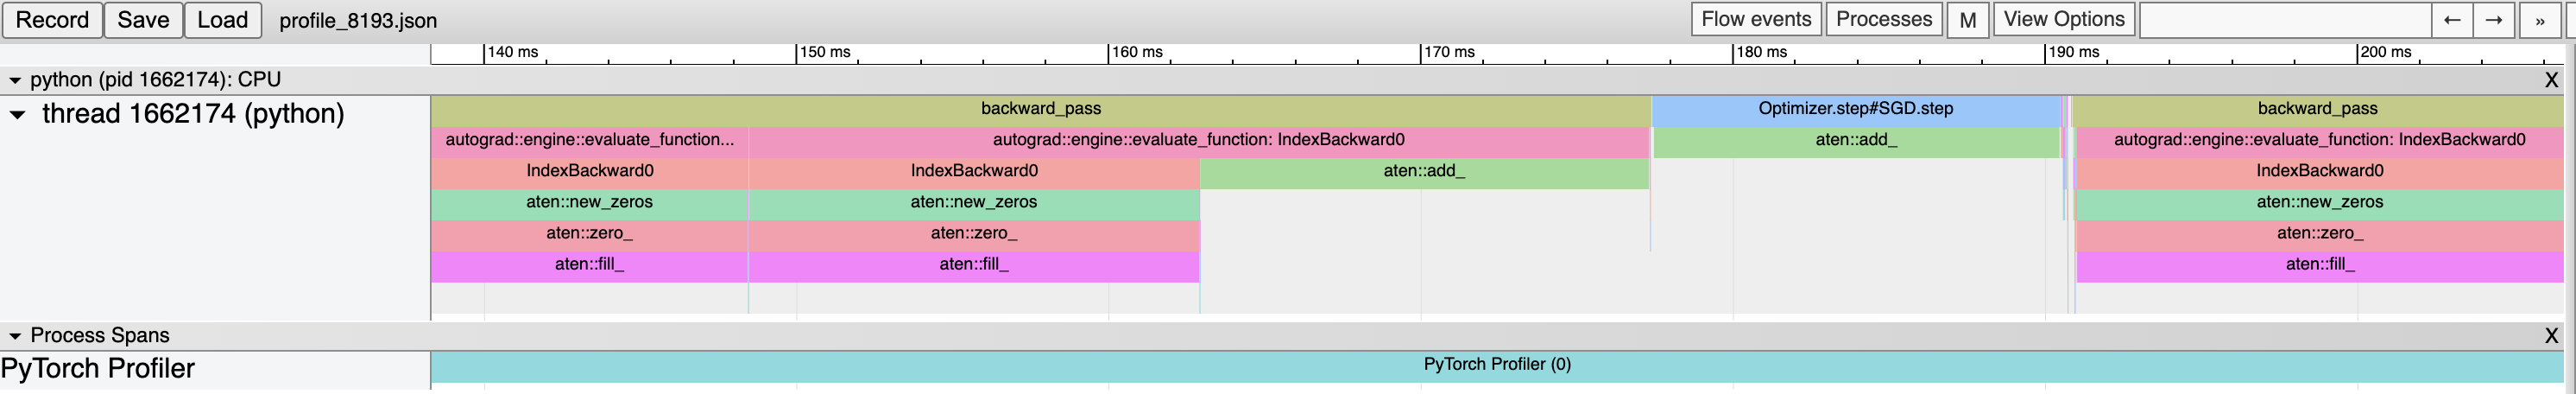
Notice that in the m = 8193 trace, there are extended calls to aten::fill_ and aten::add_ that are not present in the m = 8191 trace.
Environment details:
- OS: Red Hat Enterprise Linux 7
- Python version: 3.10.12
- Pytorch version: 2.1.2
Other comments:
- I was also able to replicate this slowdown locally (MacOS Ventura 13.2) using
mwe.py, although it was not as pronounced. - The slowdown worsens as the world size increases.
Does anyone know what causes this slowdown and how I can avoid it?