Hello everyone. I’m a complete noob and just getting my feet wet with Pytorch.
I’m using Anaconda, version: 23.7.4
Cuda version: 12.2.140
Python version : 3.11.5
Pytorch version: 2.1
I was following some tutorials, and have been using a free Google Colab account until now. Recently bought a new RTX 4070 and was very excited to stretch it’s legs. However, I was disappointed to see that it’s actually slower than a free Google Colab instance with a Tesla T4.
The model I used for testing is taken from one of the tutorials. Here it is:
Google Drive Link to Model
It takes around 3 minutes to hit 100000 epochs on T4 and on my GPU it takes around 3.5 minutes.
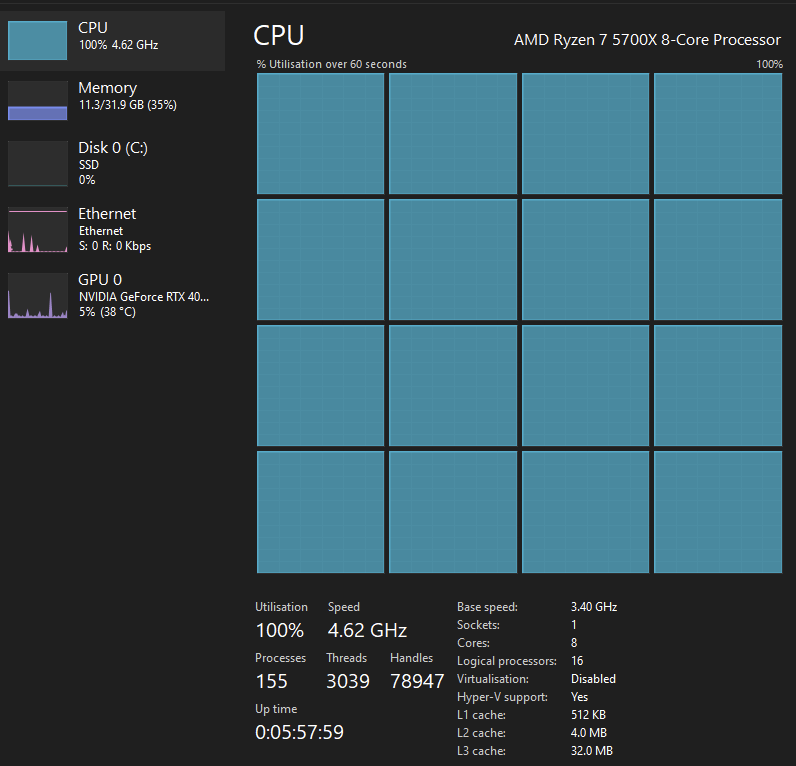
Even though the task manager shows the GPU load at 92%, there are some weird things going on.
When I train the model locally on my GPU, CPU0 is getting loaded 100%, while other cores are not stressed much.
Although it is loading a single core, torch.get_num_threads() returns 8. I tried setting it to torch.set_num_threads(os.cpu_count()) (which is 16), it did not change anything. Tried setting it to 1 also, the same result.
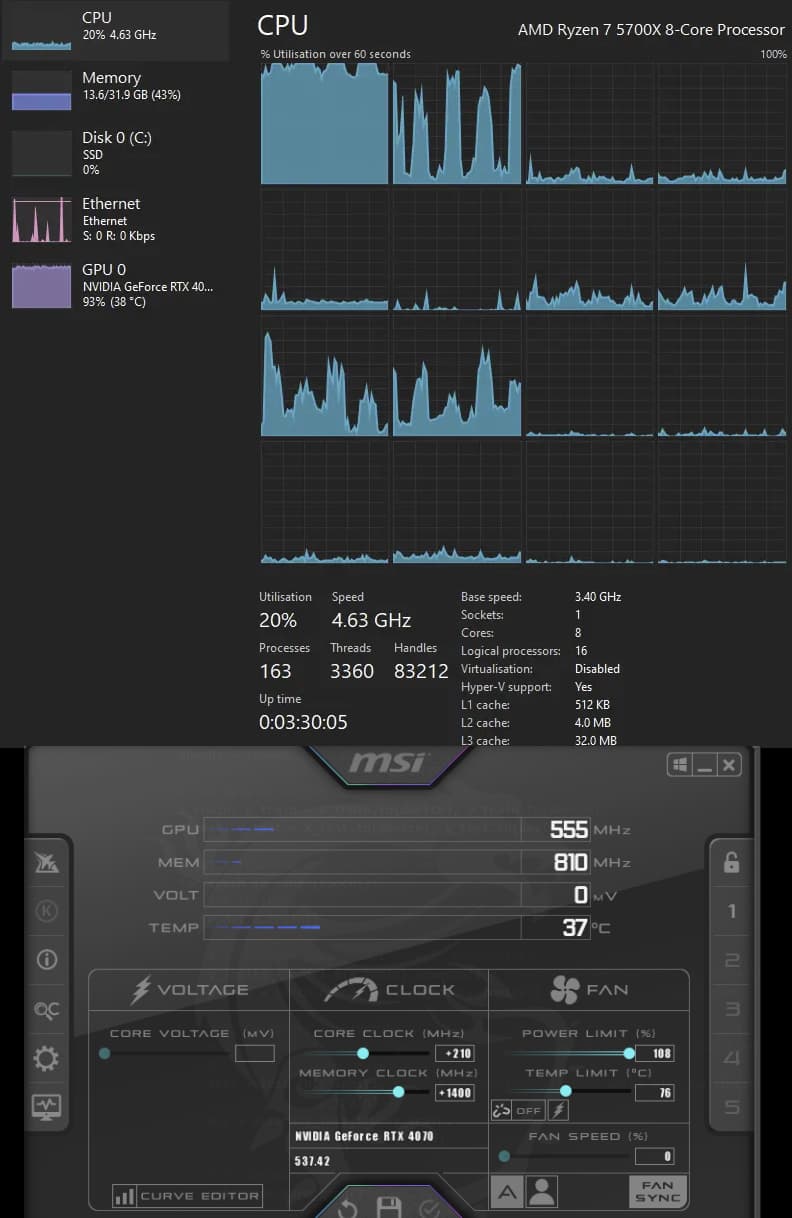
GPU temperature, GPU clock and memory clock are all extremely low for 90+% load, as you can see on the picture above.
It’s hovering around 500-700Mhz, when it is capable of 3Ghz.
Theoretically RTX 4070 should be much faster right? More cuda cores, higher frequencies etc. Yes T4 has more VRAM but, I’m hardly using 1Gig of VRAM anyways. I think I’m CPU limited, but even if that’s the case, I suspect that the single core the free Google Colab account gives me doesn’t have better single core performance than my overclocked Ryzen 5700. On the other hand GPU frequency behavior is super weird too.
What might be my problem? Thank you for your help.