I am working with the glue dataset and am using the run_glue_no_trainer.py script from the transformer github page (LINK).
I am using BERT-base with a batch size of 32 on a single GPU (using standard finetuning setting from BERT paper). When working with the CoLA dataset (~8.5k train samples) I get around 10/iterations per second. When switching to the QNLI dataset (~100k train samples) I only get around 5/iterations per second.
This slowdown is significant and even more noticeable with larger models. I would assume the iteration/s to stay approximately stay the same as long as only the dataset is swapped out.
My hardware setup is as follows:
CPU Intel(R) Xeon(R) Silver 4310 CPU @ 2.10GHz
GPU NVIDIA A40
RAM: 64GB
Not necessarily as it would depend on the data processing, and if it could create a bottleneck, as well as the sample loading, which could also create a blottleneck e.g. if you have more random accesses from a spinning HDD.
You could profile the data loading and check if it is indeed creating the slowdown or if it’s coming from another part of your training pipeline. Here is a simple example showing how the DataLoader is times in the ImageNet example.
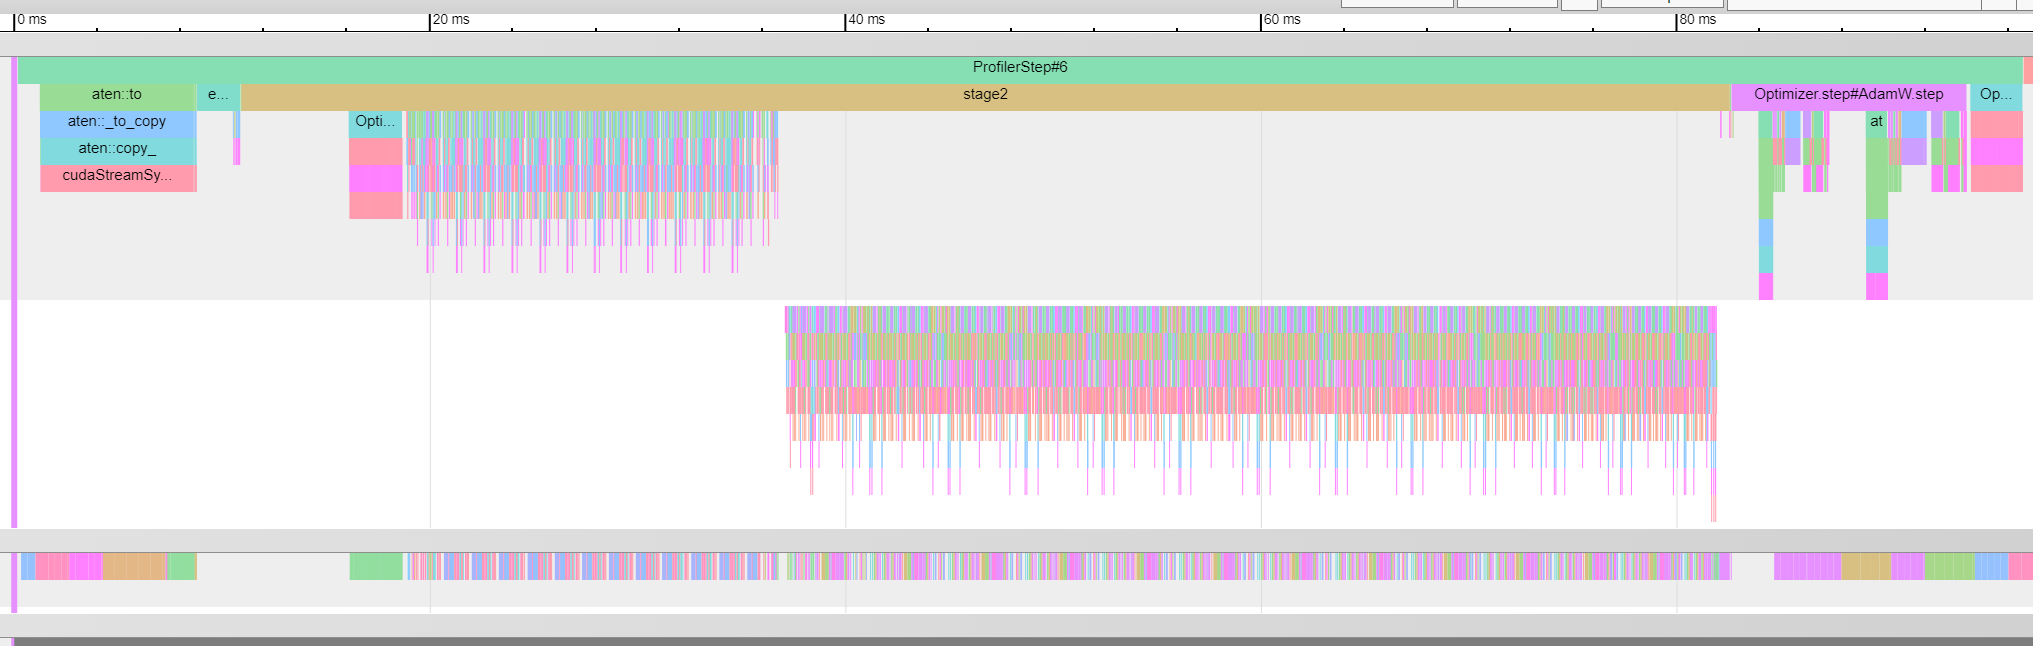
I did some timing with the PytorchProfiler (schedule with skip=10,warmup=2,active=3) to get insight into the training steps. Unfortunately I am not deep enough in the fundamentals to draw definite conclusions myself.
The following is one step in the training loop using CoLA dataset (~small).
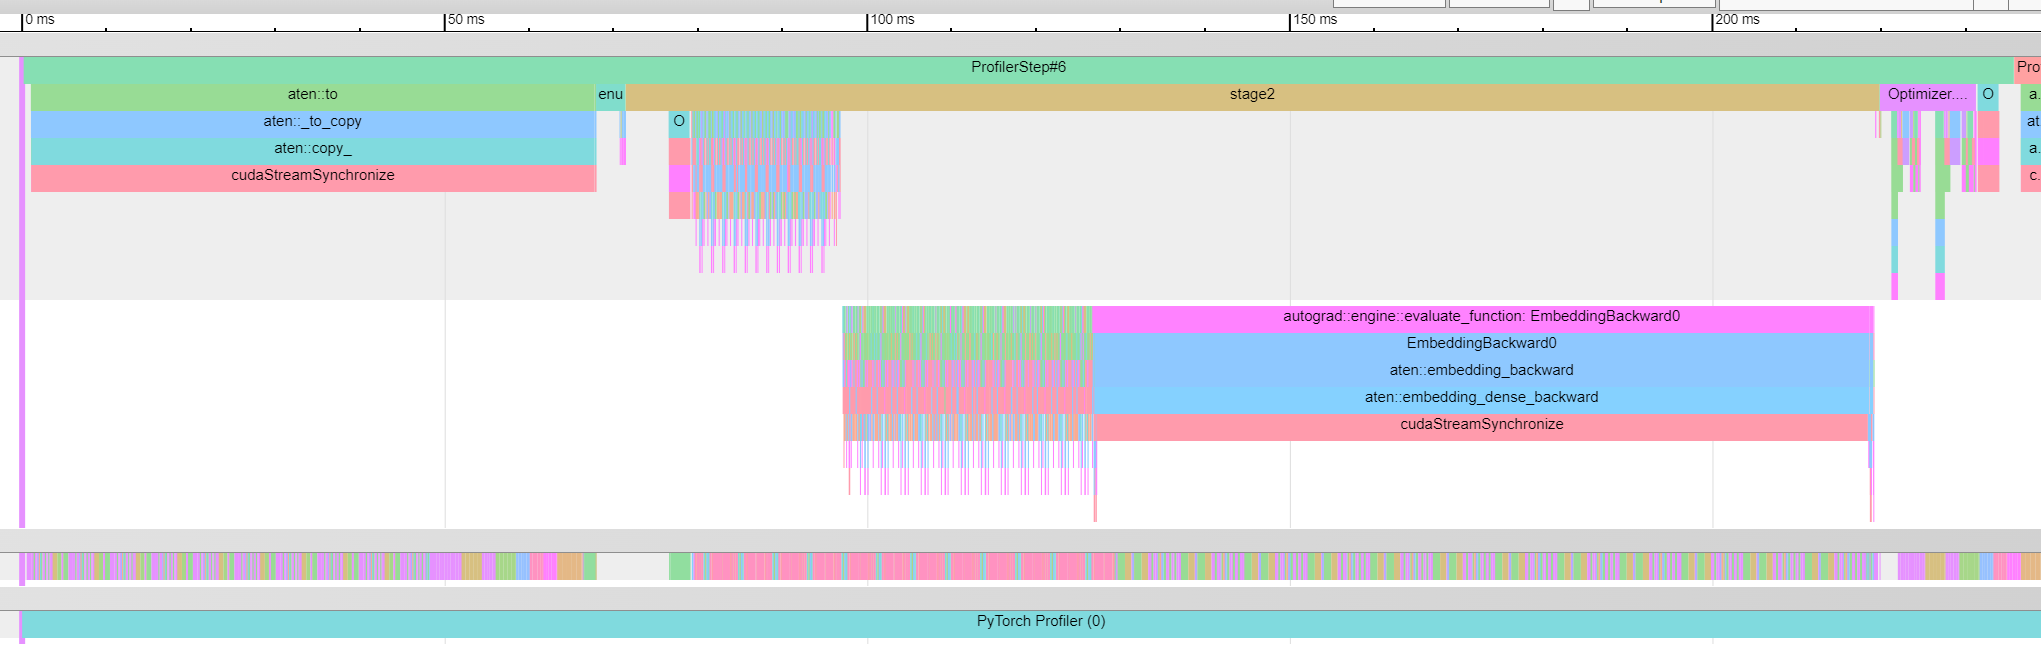
The step is significantly slower for QNLI than for (~240ms vs ~100ms) CoLA. Notably, the aten::to operation is notably slower aswell as the autograd::engine::... EmbeddingBackward0. The enumerate(DataLoader)#_SingleProcessDataLoaderIter.__next__ is taking roughly the same amount of type in both cases.
I can provide the trace files for both runs.
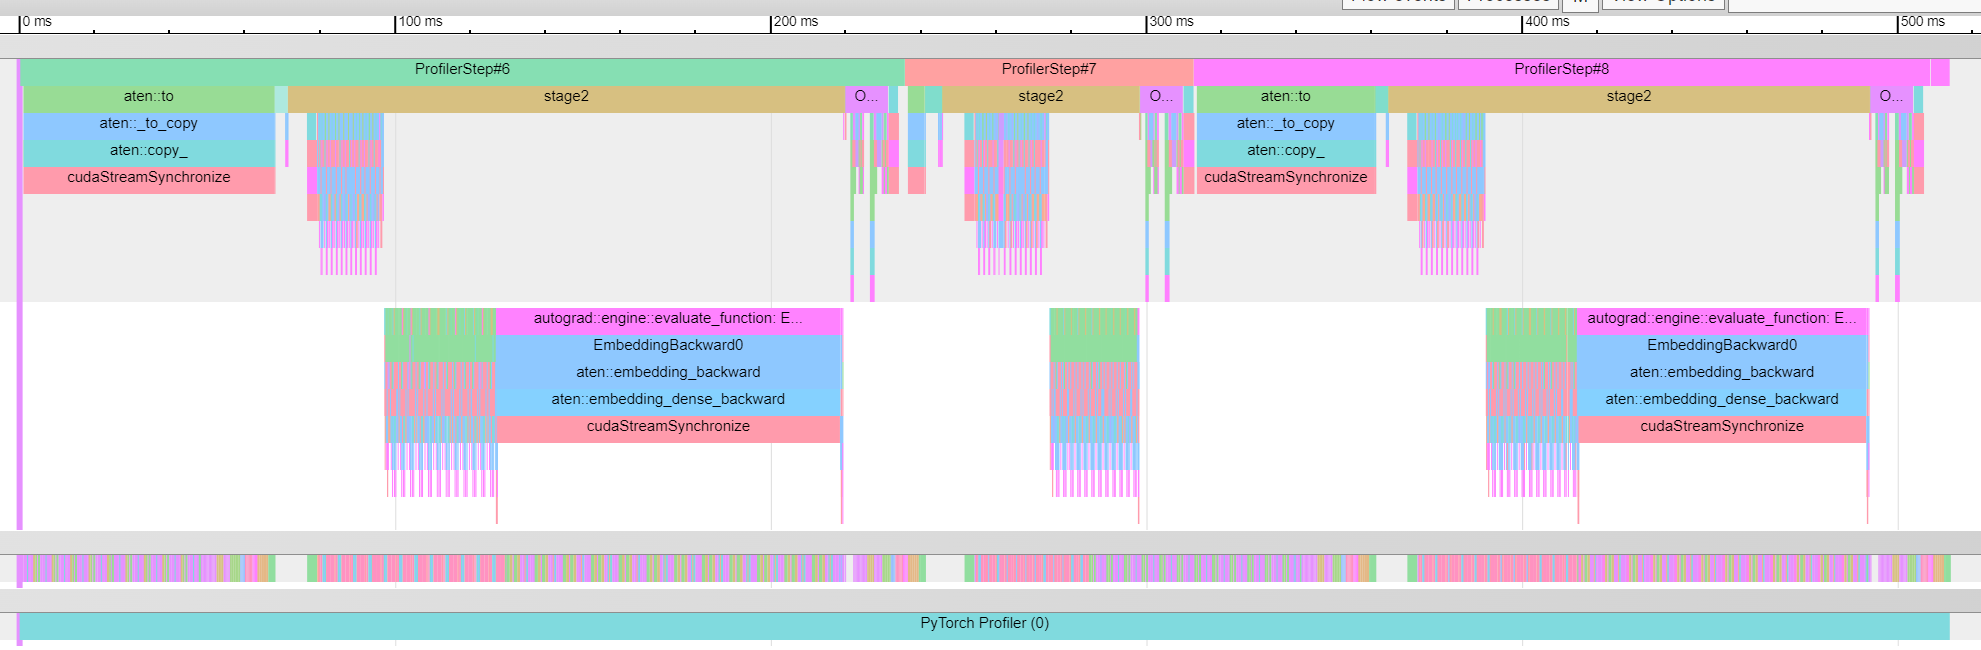
Another thing I noted is that all steps in CoLA (~small) take roughly the same time. But for QNLI, some are shorter and some longer:
You could profile your code with Nsight Systems and enable CPU stacktraces. Hovering over the synchronizing call would then show which operation is calling into it. Adding nvtx markers will also help in narrowing down which part of the code the sync is coming from.