Hi,
For one of my models I’m using torchaudio.transforms.Spectrograms and realized that the computed spectrogram of the original signal and the one that was min-max normalized don’t match.
Here is the spectrogram of the normalized signal, as I can only upload one picture. There shouldn’t be only one band at the bottom.
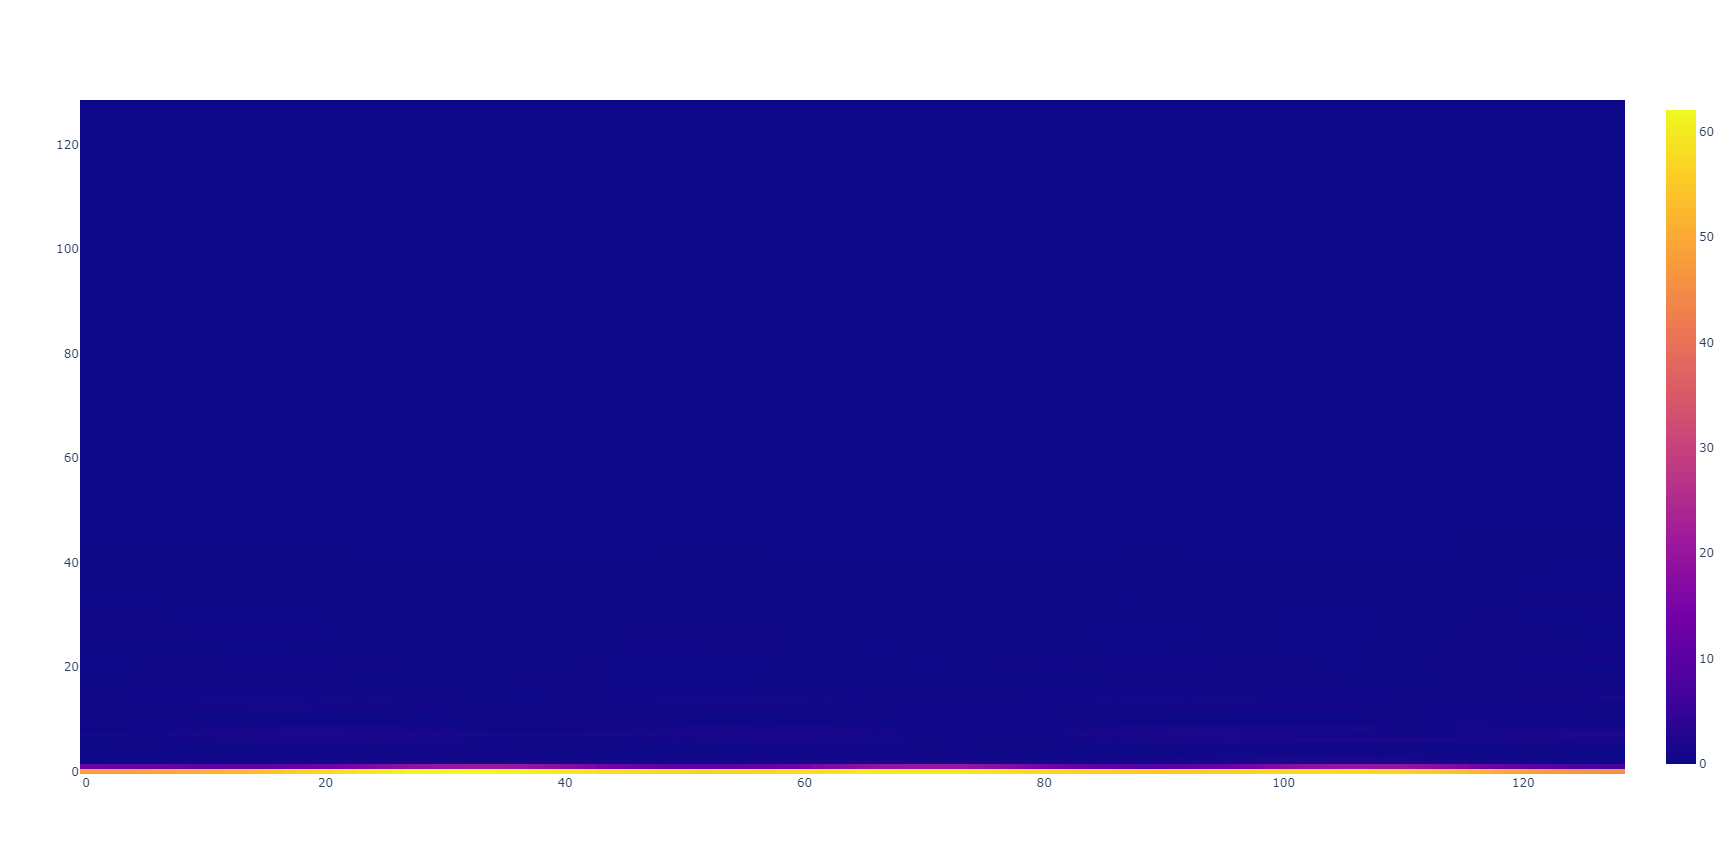
I used torchaudio.transforms.Spectrogram(n_fft=256, hop_length=4, normalized=True, power=2) to compute the spectrograms. Moreover, the input data types are the same (float64).
Any ideas ?