Hello,
I am trying to generate pictures from audio spectrogram. I couldn’t find specific examples on internet and I attempted to put together a solution myself.
I managed to implement an algorithm that can generate pictures passing files encoded mp3 or wav.
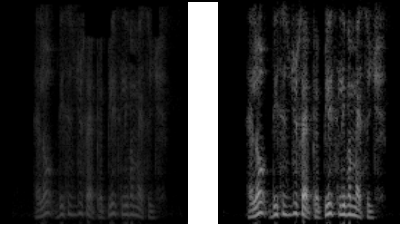
At high level everything seems to work ok for Wav files but for mp3 I seem to generate a picture where the spectrum is faint (compared to the one generated by the wav file).
I generated the files using Audacity and I saved the track to mp3 or wav.
Below is the code. I am using Jupiterlab on Sagemaker for the runtime environment.
This seems to be a standard use case in audio classification modelling. Can somebody help explain the reason behind this and whether there is any resource that could have code that can convert audio to RGB pictures for Resnet ingestion ?
import torch
import torchaudio
import matplotlib.pyplot as plt

def normalize_input(tensor):
    # Subtract the mean, and scale to the interval [-1,1]
    tensor_minusmean = tensor - tensor.mean()
    return tensor_minusmean/tensor_minusmean.abs().max()


filename = "/home/ec2-user/SageMaker/GiuseppeProjects/GiuseppeTest.mp3"

waveform, sample_rate = torchaudio.load(filename)
#waveform = np.delete(waveform, (1), axis=0)
waveform = normalize_input(waveform)
print("Shape of waveform: {}".format(waveform.size()))
print("Sample rate of waveform: {}".format(sample_rate))

#print(waveform)

plt.figure()
plt.plot(waveform.t().numpy())
plt.show()
import sys
from torchvision import transforms
import torchvision
from skimage.util import img_as_ubyte
from skimage import exposure
from sklearn import preprocessing
from PIL import Image
import numpy as np


transform_spectra = transforms.Compose([
            transforms.ToPILImage(),
            transforms.Resize((224,224)),
            transforms.RandomVerticalFlip(1)
        ])

def make0min(tensornd):
    tensor = tensornd.numpy()
    res = np.where(tensor == 0, 1E-19 , tensor)
    return torch.from_numpy(res)

def normalize(tensor):
    tensor_minusmean = tensor - tensor.mean()
    return tensor_minusmean/tensor_minusmean.abs().max()

def normalize_nd(tensor):
    tensor_minusmean = tensor - tensor.mean()
    return tensor_minusmean/np.absolute(tensor_minusmean).max()

def spectrogrameToImage(waveform):
    specgram = torchaudio.transforms.Spectrogram(n_fft=400, win_length=None, hop_length=None, pad=0,window_fn=torch.hann_window, power=2, normalized=True, wkwargs=None)(waveform )
    specgram= make0min(specgram)
    specgram = specgram.log2()[0,:,:].numpy()


    np.set_printoptions(linewidth=300)
    np.set_printoptions(threshold=sys.maxsize)

    specgram= normalize_nd(specgram)
    specgram = img_as_ubyte(specgram)
    specgramImage = transform_spectra(specgram)
    return specgramImage

def print_spec(spec):
    torch.set_printoptions(linewidth=150)
    torch.set_printoptions(profile="full")
    #spec = torchvision.transforms.ToTensor()(spec)
    spec = np.array(spec)
    #print (spec)


waveform = normalize(waveform)
spec = spectrogrameToImage(waveform)
spec = spec.convert('RGB')

plt.figure()
plt.imshow(spec)