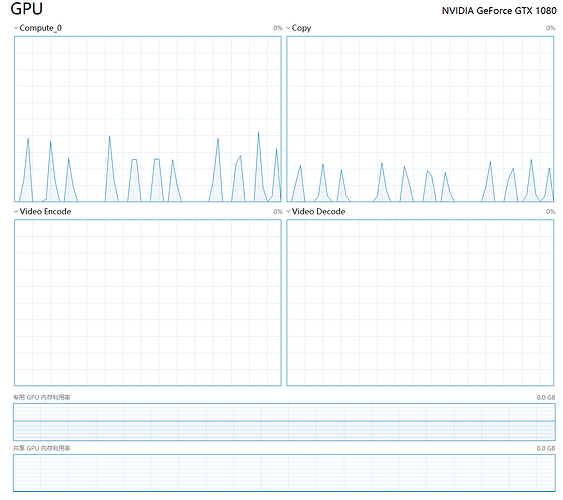
Strange Windows Task Manager Graph of GPU usage

Is it normal? What might have led to this strange shape of utilization?

The training code is as follows:

torch.cuda.empty_cache()

# Train the detector with given data:
import time
import torch.optim as optim

# specify loss function (categorical cross-entropy)
criterion = torch.nn.CrossEntropyLoss()

# specify optimizer (stochastic gradient descent) and learning rate = 0.001
optimizer = optim.Adam(hfdetector.parameters(), lr=0.0001)

start = time.time()
print(f'Training started at {time.ctime()}')
# number of epochs to train the model
n_epochs = 1000 # you may increase this number to train a final model
stop_criterion = 50
valid_loss_min = np.Inf # track change in validation loss
early_stop_count = 0

if torch.cuda.device_count() > 1:
    print("Let's use", torch.cuda.device_count(), "GPUs!")
    # dim = 0 [30, xxx] -> [10, ...], [10, ...], [10, ...] on 3 GPUs
    hfdetector = torch.nn.DataParallel(hfdetector)

for epoch in range(1, n_epochs+1):

    # keep track of training and validation loss
    train_loss = 0.0
    valid_loss = 0.0
    
    # early stop mechanism:
    if early_stop_count >= stop_criterion:
        print(f'Validation loss stops decresing for {stop_criterion} epochs, early stop triggered.')
        break
    
    ###################
    # train the model #
    ###################
    hfdetector.train()
    try:
        for data, target in train_loader:
            # move tensors to GPU if CUDA is available
            if torch.cuda.is_available():
                data, target = data.cuda(), target.cuda()
            # clear the gradients of all optimized variables
            optimizer.zero_grad()
            # forward pass: compute predicted outputs by passing inputs to the model
            output = hfdetector(data)
            # calculate the batch loss
            loss = criterion(output, target)
            # backward pass: compute gradient of the loss with respect to model parameters
            loss.backward()
            # perform a single optimization step (parameter update)
            optimizer.step()
            # update training loss
            train_loss += loss.item() * data.size(0)
    except Exception as e:
        print(f'Bad image skipped.')
        
    ######################    
    # validate the model #
    ######################
    hfdetector.eval()
    try:
        for data, target in valid_loader:
            # move tensors to GPU if CUDA is available
            if torch.cuda.is_available():
                data, target = data.cuda(), target.cuda()
            # forward pass: compute predicted outputs by passing inputs to the model
            output = hfdetector(data)
            # calculate the batch loss
            loss = criterion(output, target)
            # update average validation loss 
            valid_loss += loss.item() * data.size(0)
    except Exception as e:
        print(f'Bad image skipped.')
    # calculate average losses
    train_loss = train_loss/len(train_loader.dataset)
    valid_loss = valid_loss/len(valid_loader.dataset)
        
    # print training/validation statistics 
    print('Epoch: {} \tTraining Loss: {:.6f} \tValidation Loss: {:.6f}'.format(
        epoch, train_loss, valid_loss))
    
    # save model if validation loss has decreased
    if valid_loss <= valid_loss_min:
        print('Validation loss decreased ({:.6f} --> {:.6f}).  Saving model ...'.format(
        valid_loss_min,
        valid_loss))
        torch.save(hfdetector.state_dict(), 'model_cifar.pt')
        valid_loss_min = valid_loss
        early_stop_count = 0
    else:
        early_stop_count += 1
end = time.time()
t = int(end - start)
print(f'Training ended at {time.ctime()}, total training time is {t//3600}hours {(t%3600)//60}minutes {(t%3600)%60} seconds.')

The model definition is as follows:

import torch
import torch.nn as nn
import torch.nn.functional as F

# Define NN architecture to distinguish human and dog
class HumanFaceDetector(nn.Module):
    def __init__(self):
        super().__init__()
        # convolutional layers
        self.conv1 = nn.Conv2d(3, 16, 3, stride=1, padding=1)
        self.conv2 = nn.Conv2d(16, 32, 3, stride=1, padding=1)
        self.conv3 = nn.Conv2d(32, 32, 3, stride=1, padding=1)
        self.conv4 = nn.Conv2d(32, 64, 3, stride=1, padding=1)

        # max pooling layer
        self.pool = nn.MaxPool2d(2, 2)
        
        # dropout layer
        self.dropout = nn.Dropout(0.25)
        
        # fully connected layer
        self.fc1 = nn.Linear(16 * 16 * 64, 512)
        self.fc2 = nn.Linear(512, 256)
        self.fc3 = nn.Linear(256, 64)
        self.fc4 = nn.Linear(64, 2)

        
    def forward(self, x):
        # add sequence of convolutional and max pooling layers
        x = self.pool(F.relu(self.conv1(x)))
        x = self.pool(F.relu(self.conv2(x)))
        x = F.relu(self.conv3(x))
        x = self.pool(F.relu(self.conv4(x)))
        x = x.view(-1, 64 * 16 * 16)
        x = F.relu(self.fc1(x))
        x = self.dropout(x)
        x = F.relu(self.fc2(x))
        x = self.dropout(x)
        x = F.relu(self.fc3(x))
        x = self.fc4(x)
        return x

# initialize the NN
hfdetector = HumanFaceDetector()
print(hfdetector)
hfdetector = hfdetector.cuda()
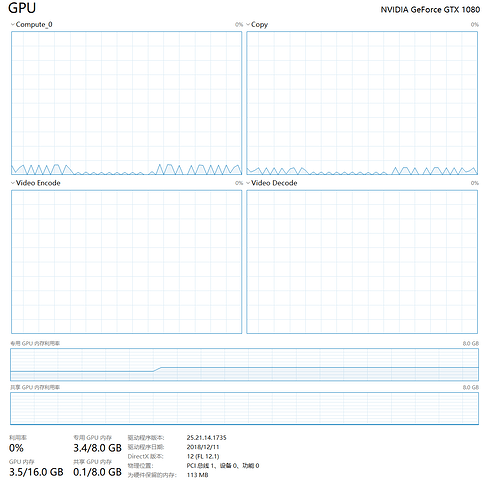
The small peaks in your GPU utilization might come from a bottleneck in your code, e.g. loading and processing the data.
Are you using multiple workers (with pin_memory=True)?
Also, is your data stored on an SSD?
Have a look at these lines of code from the ImageNet example to see how to time the DataLoader.

Using the process of elimination, from the simplest fix to trickier modifications:

  1. I moved the dataset to SSD, it turns out that the overall training time improved insignificantly, while still showing that saw-like utilization graph. Thus, hardware bottleneck may have little contribution to this phenomenon. The main bottleneck probably lies in code, as you suggested.

  2. The code I attached in the original post has a ‘try… except…’ wrapper to handle an ‘OSError: image file is truncated’ exception. This exception seems to have something to do with PIL according to here and this issue. I wonder if this try-catch behavior had led to the bottleneck, so I preprocessed the images by reducing their sizes with the following code:

from PIL import Image

def shrink_large_img(img_path):
    try:
        img = Image.open(img_path)
        if min(img.size) > 512:
            print(f'File {img_path} shrinked!')
            img.thumbnail((275, 275))
            img.save(img_path, 'JPEG')
    except OSError as e:
        print(f'Bad image: {img_path}')

(credit to this post

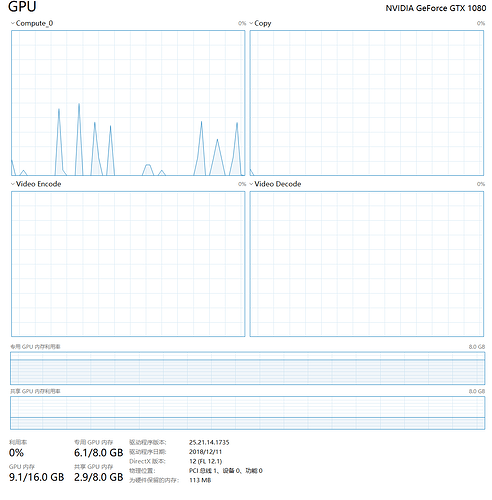
After that, when training the model again, the utilization graph changed a little bit, as follows:

You can notice that the space between the peaks disappeared. Furthermore, now there’s no ‘OSError: image file is truncated’ anymore. So it’s natural to try out the code with ‘try-catch’ behavior removed:

  1. After removing the try block, the utilization graph stays the same. So the try-catch block played no role in bottlenecking the training.

  2. I measured average loading and training time of an epoch using suggested code, the result is as follows:

Training started at Sat Jan  5 14:24:50 2019
Let's use 2 GPUs!
C:\ProgramData\Anaconda3\envs\dl\lib\site-packages\torch\cuda\nccl.py:24: UserWarning: PyTorch is not compiled with NCCL support
  warnings.warn('PyTorch is not compiled with NCCL support')
Epoch: 1 	Training Loss: 0.686348 	Validation Loss: 0.697969
Validation loss decreased (inf --> 0.697969).  Saving model ...
Time 1.014 (1.926) Data 0.936 (1.677)
Epoch: 2 	Training Loss: 0.627555 	Validation Loss: 0.590918
Validation loss decreased (0.697969 --> 0.590918).  Saving model ...
Time 0.891 (1.880) Data 0.813 (1.689)
Epoch: 3 	Training Loss: 0.402697 	Validation Loss: 0.264288
Validation loss decreased (0.590918 --> 0.264288).  Saving model ...
Time 0.979 (1.858) Data 0.900 (1.688)
Epoch: 4 	Training Loss: 0.160563 	Validation Loss: 0.104242
Validation loss decreased (0.264288 --> 0.104242).  Saving model ...
Time 1.005 (1.849) Data 0.925 (1.688)
Epoch: 5 	Training Loss: 0.086767 	Validation Loss: 0.062527
Validation loss decreased (0.104242 --> 0.062527).  Saving model ...
Time 0.950 (1.842) Data 0.872 (1.686)
Epoch: 6 	Training Loss: 0.061195 	Validation Loss: 0.048539
Validation loss decreased (0.062527 --> 0.048539).  Saving model ...
Time 0.912 (1.838) Data 0.834 (1.686)
Epoch: 7 	Training Loss: 0.047683 	Validation Loss: 0.043027
Validation loss decreased (0.048539 --> 0.043027).  Saving model ...
Time 0.875 (1.833) Data 0.788 (1.685)
Epoch: 8 	Training Loss: 0.037087 	Validation Loss: 0.034808
Validation loss decreased (0.043027 --> 0.034808).  Saving model ...
Time 0.921 (1.828) Data 0.832 (1.682)
Epoch: 9 	Training Loss: 0.033605 	Validation Loss: 0.031286
Validation loss decreased (0.034808 --> 0.031286).  Saving model ...
Time 0.908 (1.828) Data 0.838 (1.683)
Epoch: 10 	Training Loss: 0.029369 	Validation Loss: 0.029808
Validation loss decreased (0.031286 --> 0.029808).  Saving model ...
Time 1.071 (1.833) Data 0.987 (1.690)
Epoch: 11 	Training Loss: 0.026300 	Validation Loss: 0.028633
Validation loss decreased (0.029808 --> 0.028633).  Saving model ...
Time 0.913 (1.837) Data 0.840 (1.694)
Epoch: 12 	Training Loss: 0.023830 	Validation Loss: 0.025342
Validation loss decreased (0.028633 --> 0.025342).  Saving model ...
Time 1.014 (1.841) Data 0.944 (1.699)
Epoch: 13 	Training Loss: 0.021417 	Validation Loss: 0.022512
Validation loss decreased (0.025342 --> 0.022512).  Saving model ...
Time 1.014 (1.844) Data 0.945 (1.703)
Epoch: 14 	Training Loss: 0.019662 	Validation Loss: 0.023515
Time 0.949 (1.848) Data 0.871 (1.708)
Epoch: 15 	Training Loss: 0.020129 	Validation Loss: 0.022286
Validation loss decreased (0.022512 --> 0.022286).  Saving model ...
Time 0.889 (1.853) Data 0.809 (1.713)
Epoch: 16 	Training Loss: 0.016985 	Validation Loss: 0.018854
Validation loss decreased (0.022286 --> 0.018854).  Saving model ...
Time 0.959 (1.857) Data 0.879 (1.718)
Epoch: 17 	Training Loss: 0.017549 	Validation Loss: 0.020241
Time 0.993 (1.854) Data 0.909 (1.715)
Epoch: 18 	Training Loss: 0.015921 	Validation Loss: 0.016541
Validation loss decreased (0.018854 --> 0.016541).  Saving model ...
Time 0.966 (1.855) Data 0.895 (1.717)
Epoch: 19 	Training Loss: 0.015160 	Validation Loss: 0.020073
Time 0.910 (1.853) Data 0.837 (1.715)
Epoch: 20 	Training Loss: 0.015058 	Validation Loss: 0.015649
Validation loss decreased (0.016541 --> 0.015649).  Saving model ...
Time 1.010 (1.851) Data 0.941 (1.713)
Training ended at Sat Jan  5 14:50:24 2019, total training time is 0hours 25minutes 34 seconds.
  1. I suspect whether the model-saving operation or the train-eval switch might be the source of the phenomenon. So, I tried a clean training without all these stuff. Sadly, still the same.

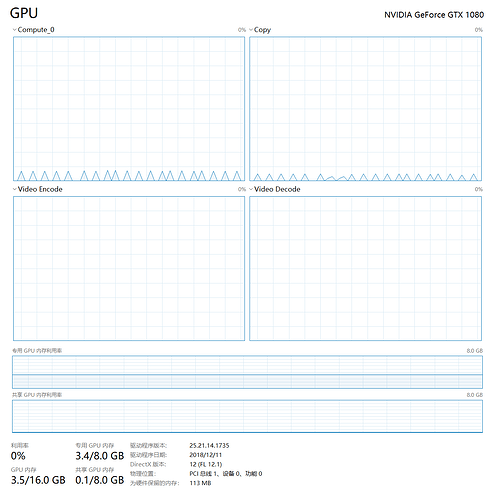
  2. I tried to double the batch_size (from 512 to 1024), the peaks are taller but still, in a zig-zag pattern:

  3. Finally, I set pin_memory=True. The utilization graph has some changes (shared memory), but still, the GPU is not fully utilized.

I wonder whether this has something to do with DataParallel, will update after I run an experiment.

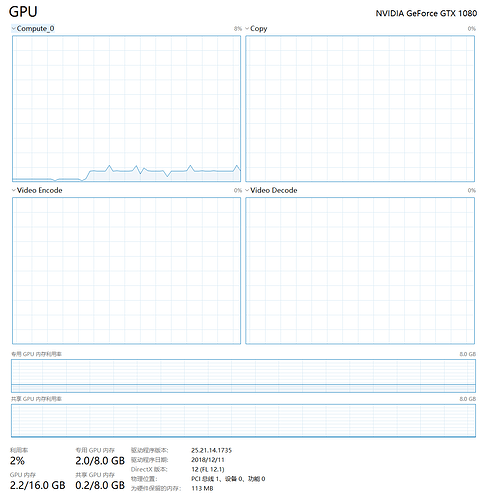
After training without DataParallel, the utilization graph becomes:

Now it’s assumable that the originally posted utilization graph is a result of lacking NCCL support in Windows platform.