Stuck at Stream Synchronization

I have designed a real-time scheduler based on LibTorch, using multiple CUDA Contexts and Streams. The problem is sometimes one of the contexts gets stuck suddenly and whatever workload I assign to it gets stuck.

This is a simple code showing how I use it:

cuCtxSetCurrent(_context);
_context.select();
_stream = at::cuda::getStreamFromPool(false, _context->index);
at::cuda::setCurrentCUDAStream(_stream);
auto output = sequential->forward(input);
_stream.synchronize();

It’s a complex scheduler and I have modified the source for PyTorch to treat each CUDA Context as a separate CUDA device. It’s interesting when using a smaller input size for the network (like 224x224), it works fine but when I use a larger input size (like 512x512) sometimes it gets stuck.

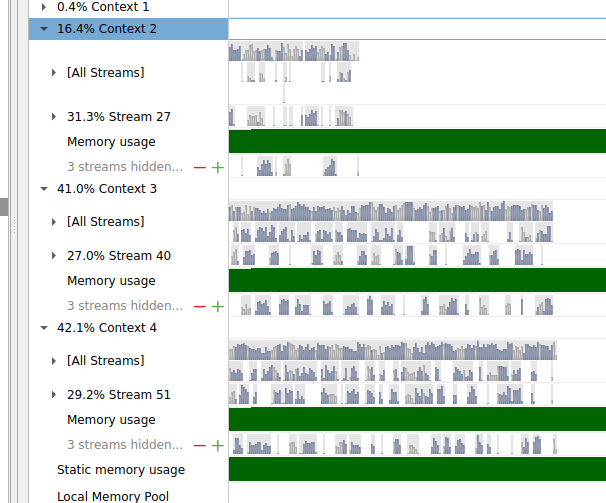
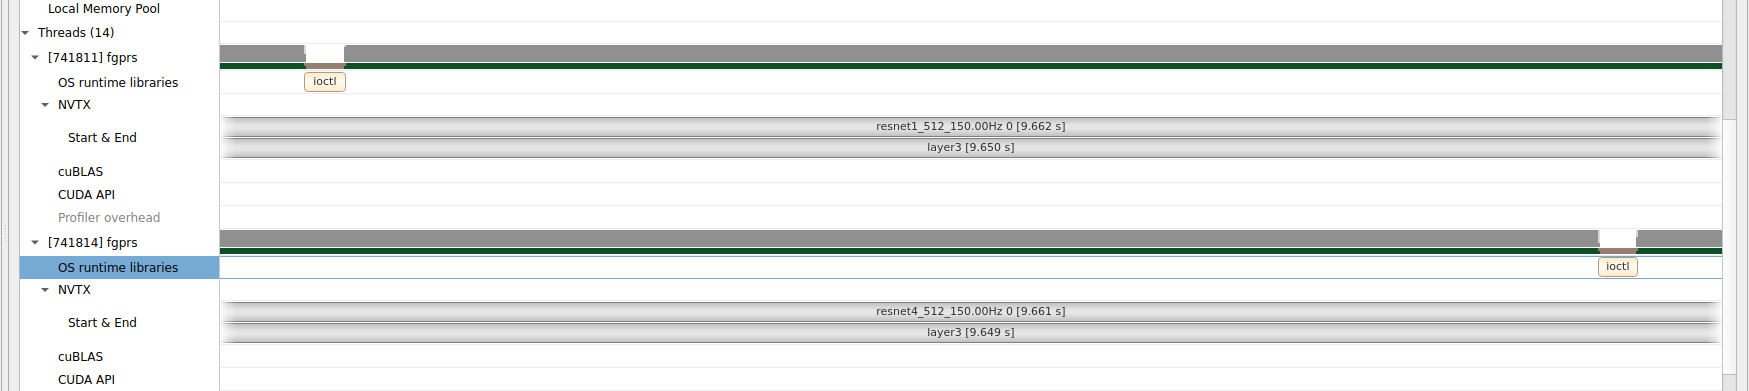
This is a screenshot from NSight Systems showing that after a specific time Context 2 has stuck and no more kernels have been scheduled in it. (And all the modules being executed in it are frozen). Using CUDA_LAUNCH_BLOCKING=0 also solves the problem but I don’t want to use it because it results in poor performance.

Does anyone have any idea what would be the reason for this?

Some guesses:

  1. The smaller model(s) may use kernels that have smaller launch bounds, allowing concurrent execution of multiple streams. I wonder if the larger models have more kernels that can only execute one-by-one on the device, exposing some potential deadlocks if the streams have complex dependencies. However, this seems unlikely as we would expect to see similar behavior with CUDA_LAUNCH_BLOCKING=1. (I assume this is what you meant as CUDA_LAUNCH_BLOCKING=0 should be the default.

  2. I wonder if synchronizing calls e.g., to cudaMalloc occur with the larger models and cause problems as the caching allocator may be running out of free memory—requiring discarded Tensors to be recycled and triggering new calls to cudaMalloc. Does setting PYTORCH_NO_CUDA_MEMORY_CACHING=1 in the small-model case also cause problems? If so then I would guess that it could be related to memory usage and caching allocator behavior.

As you mentioned, obviously number 1 is not the case. But I tried PYTORCH_NO_CUDA_MEMORY_CACHING=1 even with a smaller size the code does not get stuck, but it really drops the performance, let’s say it gets almost 10 times slower. I think GPU is not happy with parallel cudaMalloc requests. I profiled it and most of the execution time is occupied by cudaMalloc and cudaFree.

I also noticed that when a thread gets stuck (and eventually every other thread which tries to use the same CUDA Context freezes as well), there is an io control call every second in this thread like this. I don’t know what it exactly means (maybe the CPU is trying to reach the GPU but just GPU does not respond properly), but I though it would provide some information.