Hello,
Firstly thank you for all the amazing work and suggestions you lot patiently provide us with.
Secondly, I am trying to implement the tensorboard visualizations based on the following tutorial:
https://pytorch.org/tutorials/intermediate/tensorboard_tutorial.html#inspect-the-model-using-tensorboard
I can add scalars without any issues, and am sort of adding the images with their predictions.
However, as you can see in the following screenshot, the graphs are not displayed correctly:
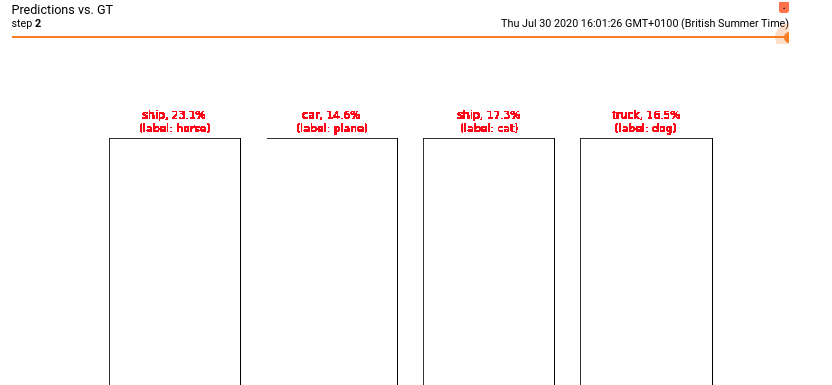
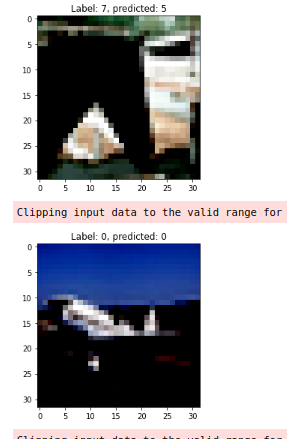
As sanity check, I am displaying the images in question while inferring. They seem to be fine (except for the horrible resolution - any advice on that too):
My code for visualisations is as follows:
    def _img_to_prob(self, images):

        output = self.model(images)

        # convert output probabilities to predicted classes
        _, preds_tensor = torch.max(output, 1)

        preds = np.squeeze(preds_tensor.cpu().numpy())

        return preds, [F.softmax(el, dim=0)[i].item() for i,el in zip(preds, output)]

    def _display_images(self, img, one_channel = False):
        if one_channel:
            img = img.mean(dim = 0)

        img = img/2+0.5 # unnormalise
        # Detach from the img tensor from the GPU
        npimg = img.cpu().numpy()

        if one_channel:
            plt.imshow(npimg, cmap="Greys")

        plt.imshow(np.transpose(npimg, (1,2,0)))


    def _visualise_preds(self, images, labels, one_channel):
        """
        Generates a matplotlib Figure using a trained network, along with images
        and labels of a set of images, that shows the networks top prediction
        along with it's probability alongisde the actual label.
        Coloured based on the correctness of the prediction.
        """
        print(f"Images have shape: {images.shape}")

        preds, probs = self._img_to_prob(images)
        fig = plt.Figure(figsize=(12, 12))

        for i in np.arange(4):
            ax = fig.add_subplot(1, 4, i+1, xticks = [], yticks = [])
            self._display_images(images[i], one_channel = one_channel)

            #sanity check; display image
            plt.title(f"Label: {labels[i]}, predicted: {preds[i]}")
            plt.imshow(np.transpose(images[i].cpu().numpy(), (1,2,0)))
            plt.show()

#             ax.show()
#             plt.show()

            ax.set_title("{0}, {1:.1f}%\n(label: {2})".format(
                classes[preds[i]],
                probs[i] * 100.0,
                classes[labels[i]]),
                        color=("green" if preds[i]==labels[i].item() else "red"))

        return fig
Much appreciated!
[edit]
I am adding the validation loop in order to showcase how they are being added to Tensorboard
            running_val_loss = 0
            print("epoch",epoch)
            print("epoch%eval_per", epoch%self.eval_period)
            # Validation loop every self.eval_period epochs
            if epoch%self.eval_period == 0:
                print(f"Starting evaluating at epoch: {epoch}")
                with torch.no_grad():
                    for idx,data in enumerate(self.valloader):

                        # set model in eval() mode
                        self.model.eval()

                        inputs,labels = data
                        # Place inputs/lables on the GPU
                        inputs = inputs.to(self.device)
                        labels = labels.to(self.device)

                        # Predict outputs
                        outputs = self.model(inputs)

                        # Obtain and append val_batch_loss
                        val_loss = self.criterion(outputs,labels)
                        val_batch_loss.append(loss.item())
                        running_val_loss += val_loss

                        # Obtain and append val_batch_acc
                        correct_preds = [torch.argmax(i) == torch.argmax(j) for i,j in zip(outputs,labels)]

                        val_acc = correct_preds.count(True)/len(correct_preds)
                        val_batch_acc.append(val_acc)

                    val_epoch_loss.append(torch.tensor(val_batch_loss).mean())
                    val_epoch_acc.append(torch.tensor(val_batch_acc).mean())


                    # Visualise the predictions on the last validation batch

                    print(f"len inputs of last batch: {len(inputs)}")

                    self.writer.add_scalar("Validation Loss",
                                           running_val_loss/len(self.valloader),
                                           global_step = epoch
                                          )

                    self.writer.add_figure("Predictions vs. GT",
                                           self._visualise_preds(inputs, labels, False),
                                           global_step = epoch
                                          )

                    running_val_loss = 0.0