I’m having a recurring out-of-memory issue that seems to be caused by memory fragmentation:
torch.cuda.OutOfMemoryError: CUDA out of memory. Tried to allocate 2.00 MiB (GPU 0; 23.65 GiB total capacity; 12.35 GiB already allocated; 2.56 MiB free; 22.33 GiB reserved in total by PyTorch) If reserved memory is >> allocated memory try setting max_split_size_mb to avoid fragmentation. See documentation for Memory Management and PYTORCH_CUDA_ALLOC_CONF
Note: allocation attempt is 2MB, card has 24GB of RAM, 12.35GB already allocated, only 2.56MB free out of 22GB reserved.
Things I considered already:
- This is training of an RNN on variable sequence lengths. I set
drop_last=Truein the dataloader, and I tried forcing the first batch to have the longest sequence, which does not cause an instantaneous crash. It crashes only after some epochs, so it’s not a momentary issue caused by the unusual size of a batch. - I checked to see that all tensors retained for logging are either detached or have
.item()called on them. - It’s not a cuda cache filling up issue: Every training epoch ends with a call to
torch.cuda.empty_cache() - It’s not a hardware issue: the issue recurred on separate machines, and the main machine has two GPUs and behavior was identical independently from which GPU the code was using.
- Memory leaks: Maybe I don’t understand something but I have evidence to the contrary.
My next step was to add logging of torch.cuda.memory_stats() to tensorboard as part of training to see if memory is leaking. I log every 500 steps (roughly 1.5 epochs), and I would expect to see allocation.*.current and allocated_bytes.*.current to increase (where * is one of large, small, all). Instead what I see is that all these metrics are roughly static - there’s noise but no obvious trend across the roughly 9000 steps until the crash.
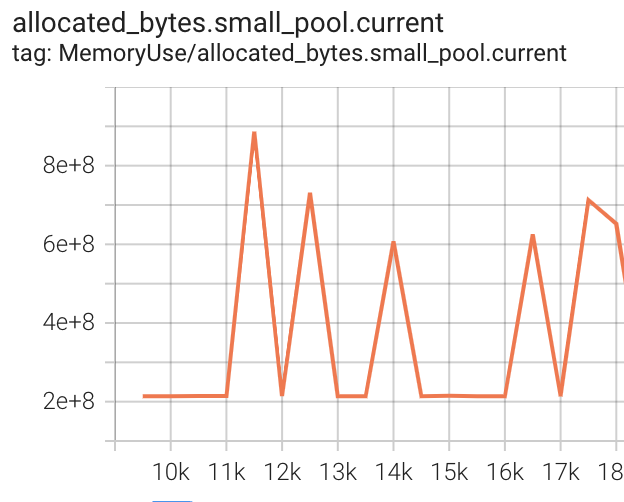
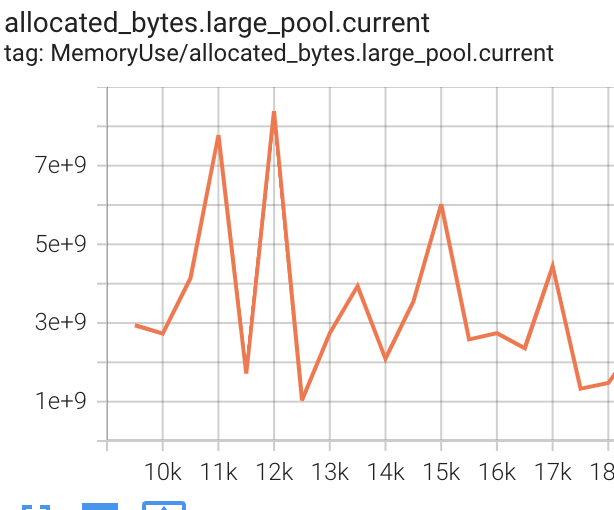
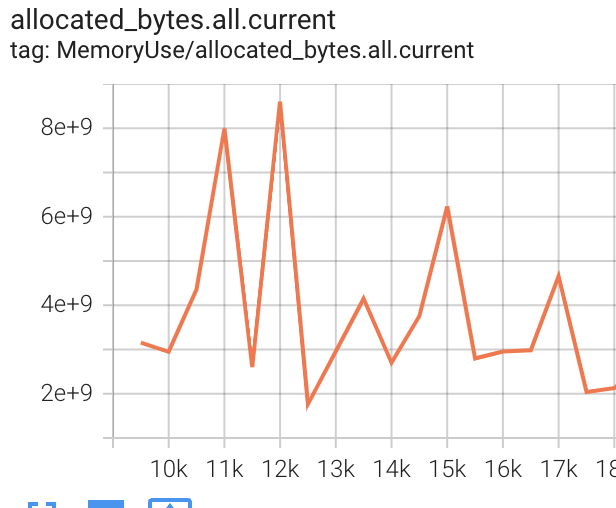
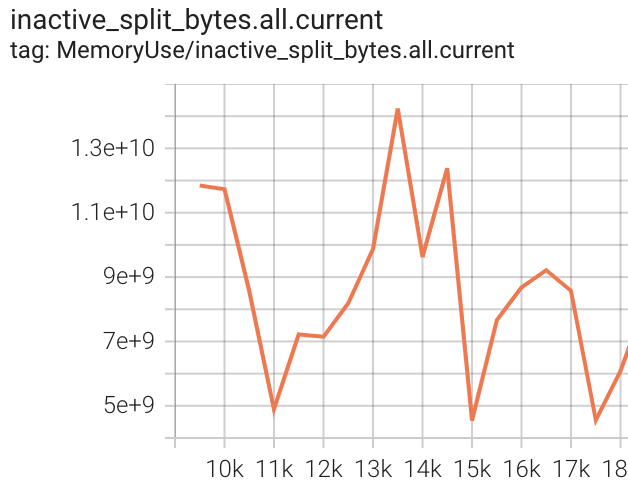
Seems like a slam-dunk for a memory fragmentation issue and not a leak, right? But, I would expect one of inactive_split_bytes.*.current and/or inactive_splits.*.current to display an increasing trend, but that’s not what I see.
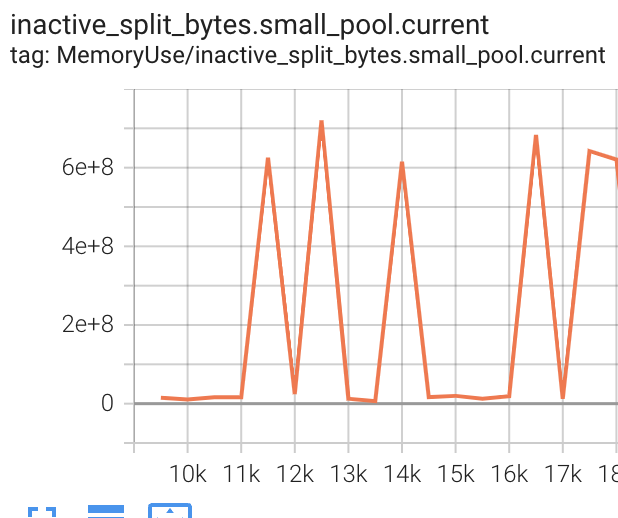
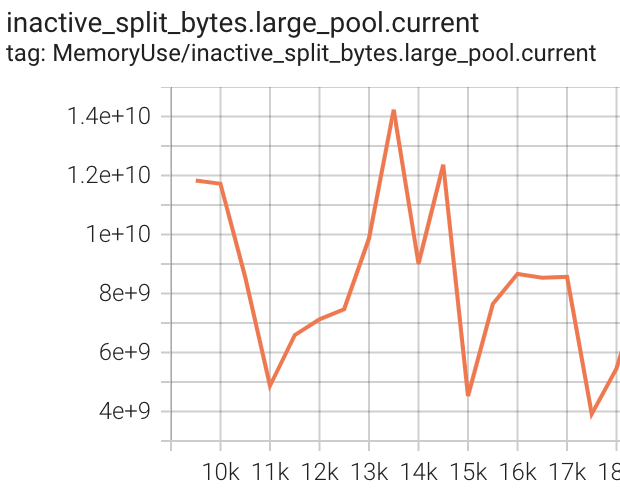
Having said all that, the exception shows that free memory is much less than (reserved memory - allocated memory), so I’m wrong somewhere down the line - it’s very probably a memory fragmentation issue.
The way I see it is that I misunderstood how the metrics are supposed to show memory issues. Any ideas on metrics that will reliably show memory fragmentation?
Also, another issue I don’t understand really is setting max_split_size_mb - any recommendations there? I mean, I don’t understand my model’s memory allocation behavior, I suspect I need to in order to set the value intelligently. Any recommendations on how to gather this information and how to choose the value?
Thanks!