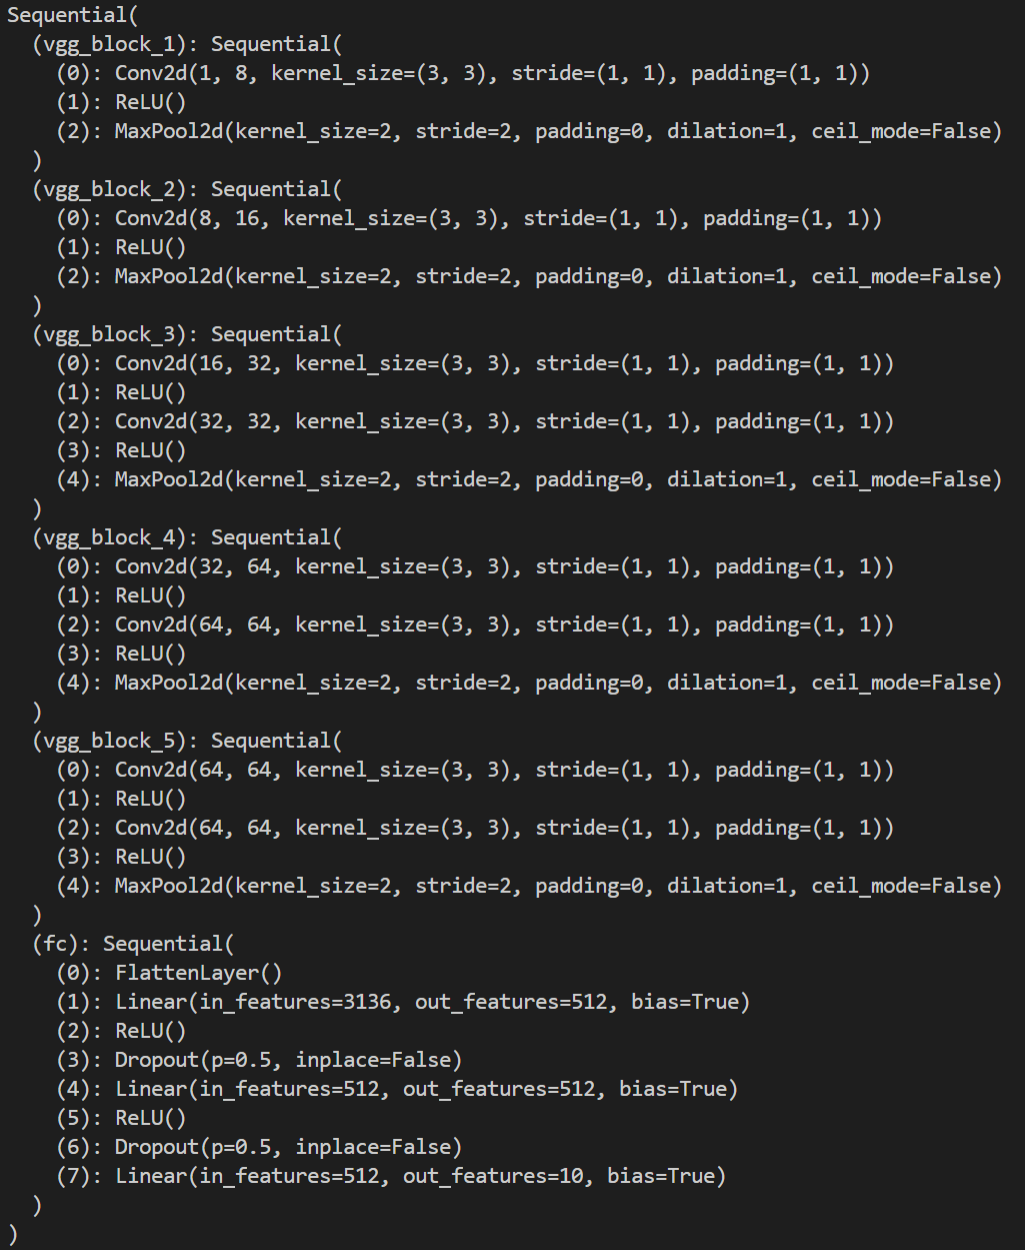
I tested the inference of the vgg16 network with the pytorch framework, and found that the first layer of network (convolutional layer) for the first inference took a very long time, probably dozens of times the total time of the second reasoning. I know this may be the first Once booted on the GPU, but I want to know what the hell are doing this time?
Machine Configuration:GTX2080Ti
key Code:
cnt = 0
for i in gpu_input_data:
y = net(i)
cnt += 1
time.sleep(0.02)
if cnt > 20:
break
The timeline measured with pytorch’s profile is as follows:
first time inference: 300ms, the average cost time the rest 19 times inference: 13ms
The first CUDA operation creates the CUDA context on the device, which adds some overhead.
Also, since CUDA operations are asynchronously called, you would need to synchronize the code before starting and stopping a timer via torch.cuda.synchronize().
Additionally, if you are using torch.backends.cudnn.benchmark = True the first iteration using a new input shape will profile different cudnn kernels and select the fastest one, which also adds overhead.
thanks for your reply!
I turned on the print time after synchronization, and I got the same result. In addition, I used the torch.autograd.profiler.profile, I don’t know if this will introduce additional overhead in the first inference.
Thanks for the update. I’m not completely sure, but it looks as if all calls take approx. the same amount of time?
If the difference in in the colors, note that I’m partly colorblind and cannot see these differences that clearly so you would have to explain what you expect and what you are seeing now.
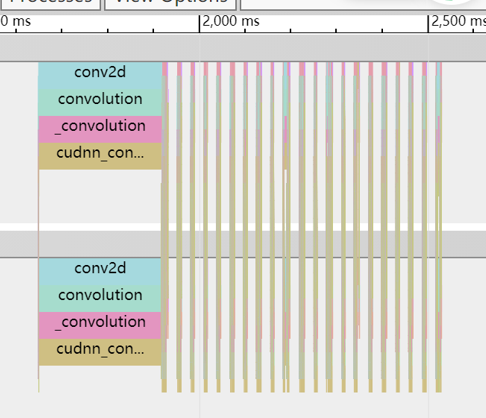
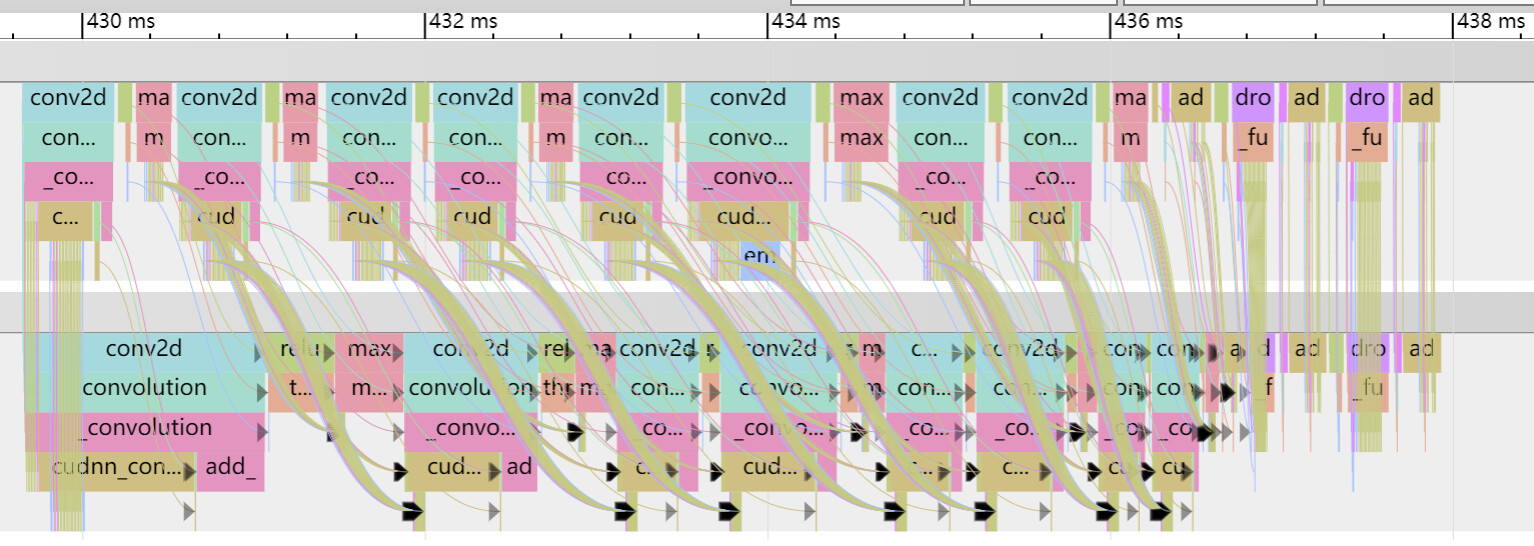
This image is a process of 20 inferences, the first of which takes longer than the others. As can be seen from the figure, the first reasoning takes a very long time after going through the first layer network. The following is the operations done by Pytorch each time the picture is enlarged.
The interpretation of the previous picture involves 20 inferences, and the first one takes more time than the others.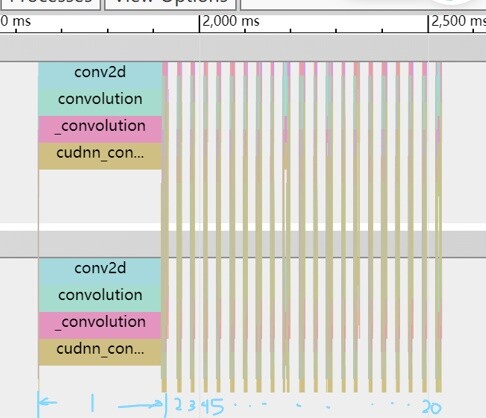
Is this the very first execution of this layer in this script or are you seeing this increased time in another epoch of the model?
I would not recommend to profile the first execution for the aforementioned reasons (CUDA context creation, cudnnFind in benchmark mode, GPU startup/warmup time).
This graph is not the first execution of the network, it is one of many inferences that follow. Thank you for your answer, I probably understand the extra cost of the first execution of the model. There is one more question I want to understand. According to your statement, the first execution of the model after it is loaded into the GPU will inevitably take time to perform some initialization operations. If it is unavoidable, can this time be shortened in some way.
It depends what is causing the slow down, i.e. the context creation cannot be avoided.
Could you post a code snippet to reproduce this issue you are seeing so that we can profile it?
You need to run the vgg.py You’ll get vgg.json , vgg.json In Chrome chrome://tracing/ The website can be parsed into visual graphics, and the core code of the test is in the test function.
github project: