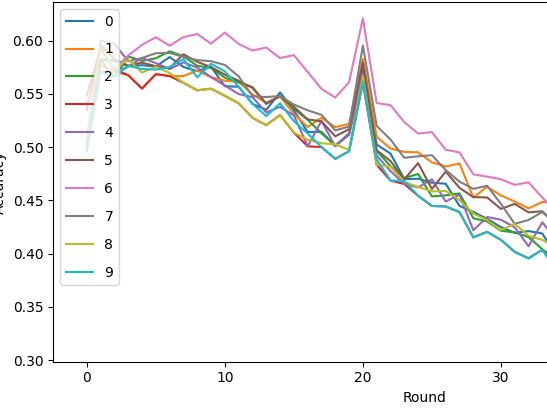
I am trying to plot accuracy that shows some spikes at certain training rounds… My question is how can I find that there is a sudden spike in the graph and eventually which nodes are having the spike…
I tried to apply the quantile method, but that also returns a value for no spikes round as well. Can I get any method which just returns true positives and not false positives.
If I were you, I would take three samples side by side and determine if there’s a bump in the middle. If there’s a bump, note the size of the bump. If the bump is bigger than any previous bumps, mark the location and value of the bump. Do this for every location in the graph.
graph = [1, 5, 1, 2, 1]

def spike_value(graph):
    spike_record = 0
    spike_location = 0
    spike_value = None
    for i in range(len(graph) - 2):
        chunk = graph[i:i+3]
        left, middle, right = chunk
        # if it's a bump
        if middle > left and middle > right:
            bump_size = ( (middle - left) + (middle - right) )  / 2
            if bump_size > spike_record:
                spike_location = i + 1
                spike_record = bump_size
                spike_value = middle
    return spike_value

print(spike_value(graph))
note: this algorithm will not detect the spike if the spike location is either at the very beginning or very end of the graph
Thanks @Brock_Brown… but the the spike location gone unnoticed at beginning or end would be an issue., and also I think this won’t work in the case where there will be multiple spikes at one particular instance…