Hi,everyone! I’m a new coder using Pytorch.I have a question, why the time spent on cpu is equal to time spent on gpu? The time costs on cpu and time costs on cuda is very approximate,and I suspect the code run on cpu, but with tool of top and ‘watch -n 3 nvidia-smi’ in another terminal, I saw the change with the gpu when code run on gpu. Is there any method to show, the code really run on cuda? Thank you very much! My Pytorch version is 1.3.0, CUDA 9.0.
code is:
import torch
input = torch.randn(1000, 3, 224, 224)
conv1 = torch.Conv2d(3, 5, (3, 3))
conv2 = torch.Conv2d(5, 7, (5, 5))

with torch.autograd.Profiler.profile(use_cuda=True) as prof:
    out = conv1(input)
    out = torch.relu(out)
    out = conv2(out)
    out = torch.relu(out)
    out = torch.relu(out)

print("prof is:\n{}".format(prof))
Thanks for your reply.And I change the code with your addvision,and the time cost on cpu and cuda have reduced largely, but they are still neally equal.
And the worse situation is ,the self time are wrong at same time.
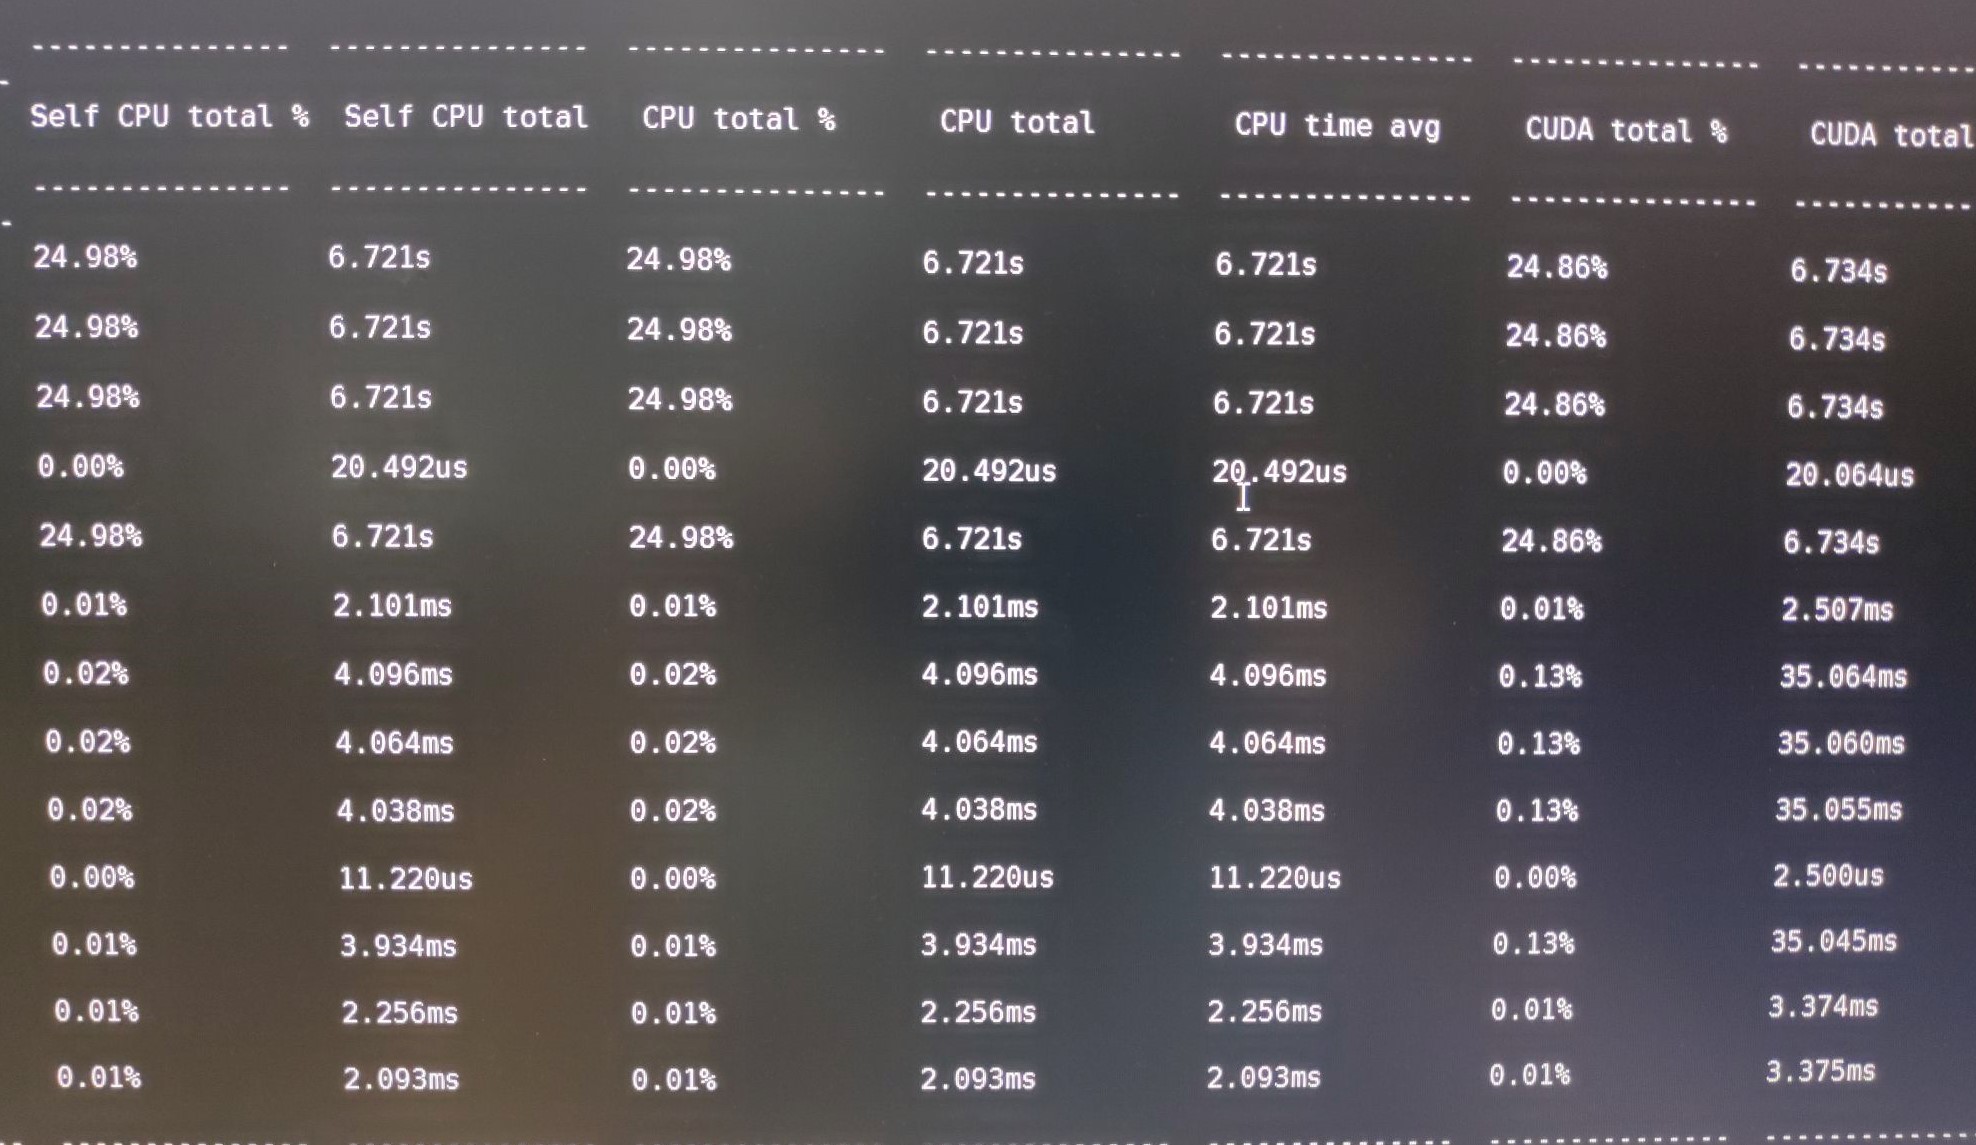
The Self CPU total time is the kernel cost time on self, such as conv2d, it use convolution and _convolution and cudnn_convolution as actual running kernel.The time cost on cudnn_convolution cost time is 17.935ms, and _convolution’s Self CPU total is (17.998 - 17.935=0.063ms),its parent convolution cost (18.021 - 17.998 = 0.023ms), and conv2d cost (18.041 - 18.021 = 0.02ms).And CPU total are right.
So I am wondering, are there something running wrong?
I watch the running situation use command ‘watch -n 1 nvidia-smi’,but I found that, the first card run normal, are when it run over, the second card started to run, so did 3th and 4th.But I don’t set four threads or processes. Why this happens? Does profile with cuda run all gpu cards to profiler, and only show one card’s profile result?
I am confused, thanks a lot if you can give me addvisions or give me some useful links.
May a good day!