Originally, I want to optimize my code, figure out which operation is time consuming, to make my code run more fast.
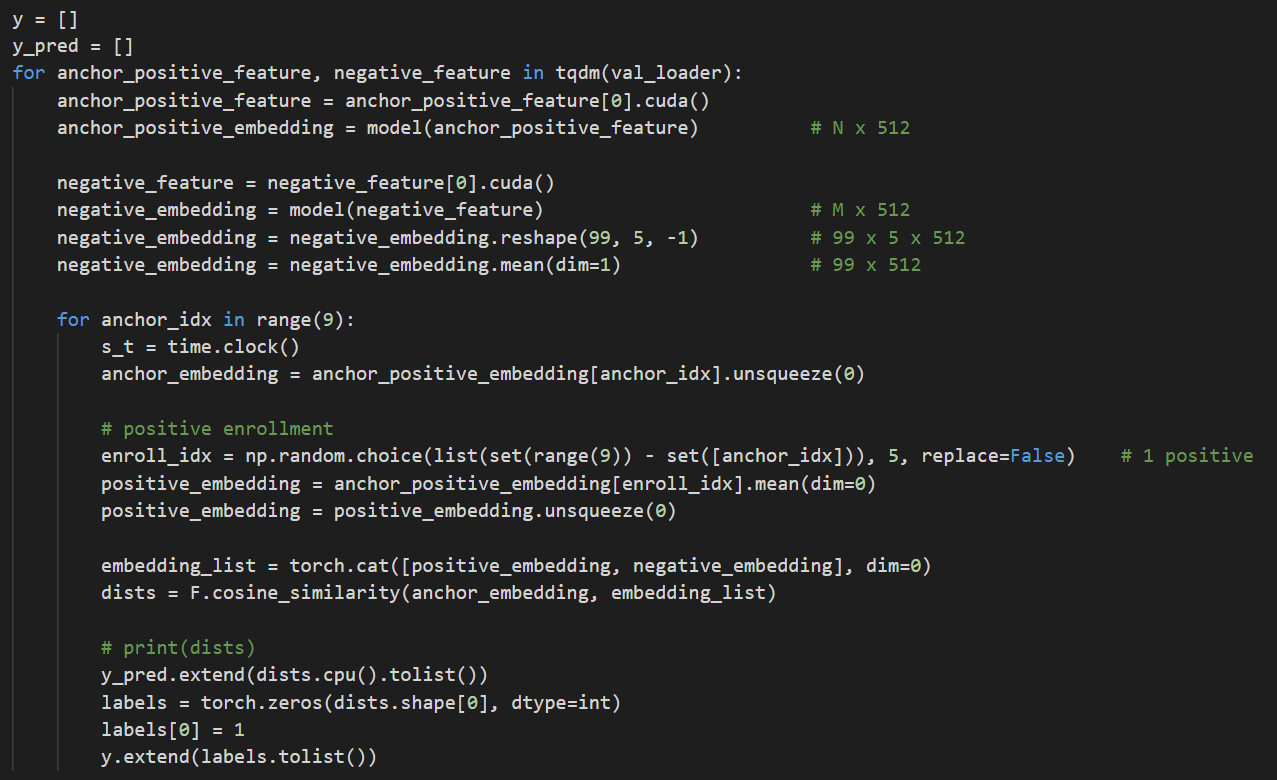
This is my original code. It’s just some feature extracted to be inferred by model, and then compute some distances of the embeddings. It works with GPU.
I add time called almost each line to show the time consuming. kind of crazy…
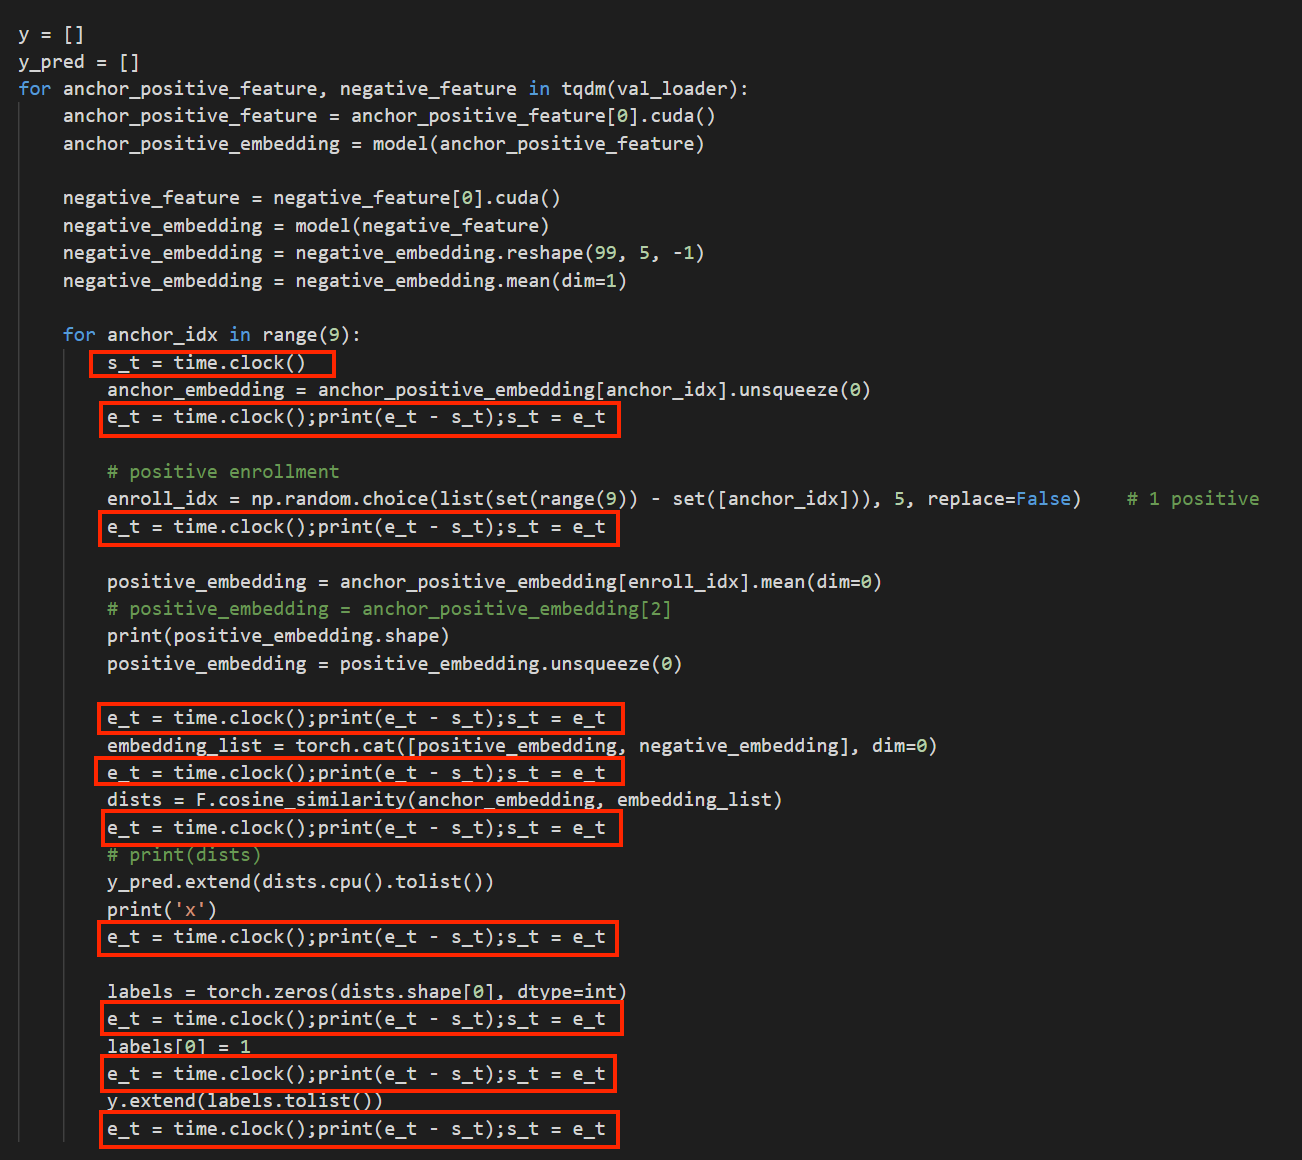
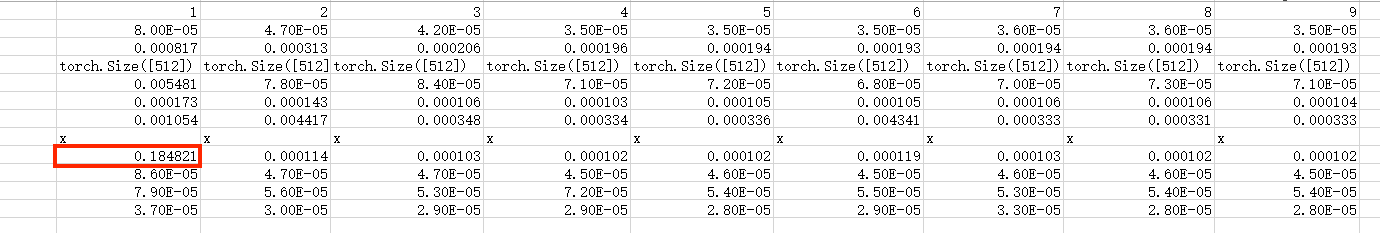
There is a 9 times loop in my code. It shows that this line(blue box)of the 1st loop ost most of the time.

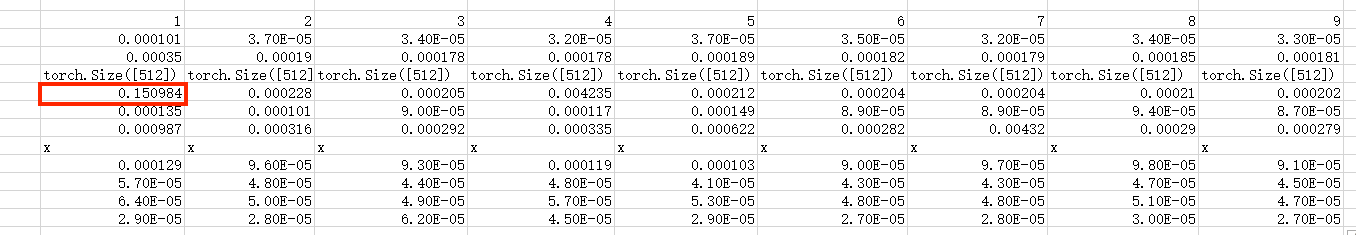
The time is show as follow(red box).
I change above blue box line as the blue box line as follow. That is
positive_embedding = anchor_positive_embedding[enroll_idx].mean(dim=0)
to
positive_embedding = anchor_positive_embedding[2]
Now the code like this, just the blue box code changed.
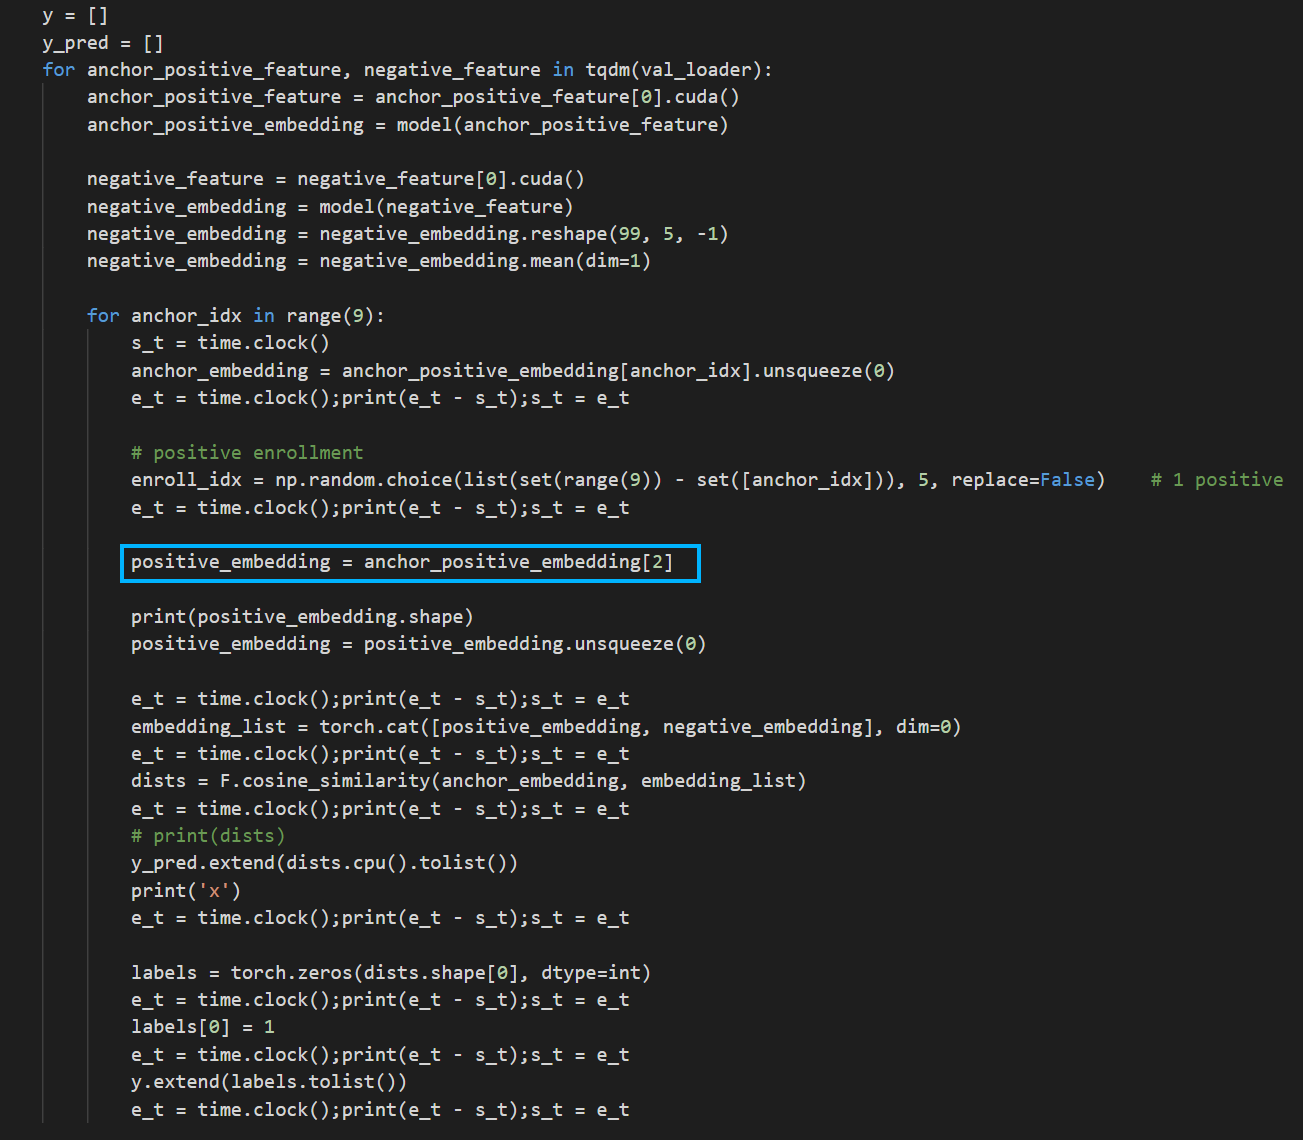
However, the most time consuming operation changes.
That is:
y_pred.extend(dists.cpu().tolist())
While this line doesn’t consume too much time before the blue box line changing.
It’s obviously odd. I use line_profiler to obtain time statistic. Almost the same.
Moreover, when I uncomment the
print(dists)
in my code, this line becomes the most time consuming, only in the 1st loop. So strange.
More infos about my environment:
python3.7.9
torch 1.4.0
cuda 10.1
docker environment
If need more infos, I will provide.
Is it a bug? Or which operation is the most time consuming in my code, in fact?