Hi Everybody,
I am using the torchaudio.transforms.Spectrogram to get the Spectrogram of a sin wave which is as follows:
Fs = 400
freq = 5
sample = 400
x = np.arange(sample)
y = np.sin(2 * np.pi * freq * x / Fs)
Then, I get the Spectrogram of the mentioned sin wave as follows:
specgram = torchaudio.transforms.Spectrogram(n_fft=256,
win_length=256,
hop_length=184,
window_fn=torch.hamming_window,
power=1,
normalized=True)
output = specgram(torch.from_numpy(y))
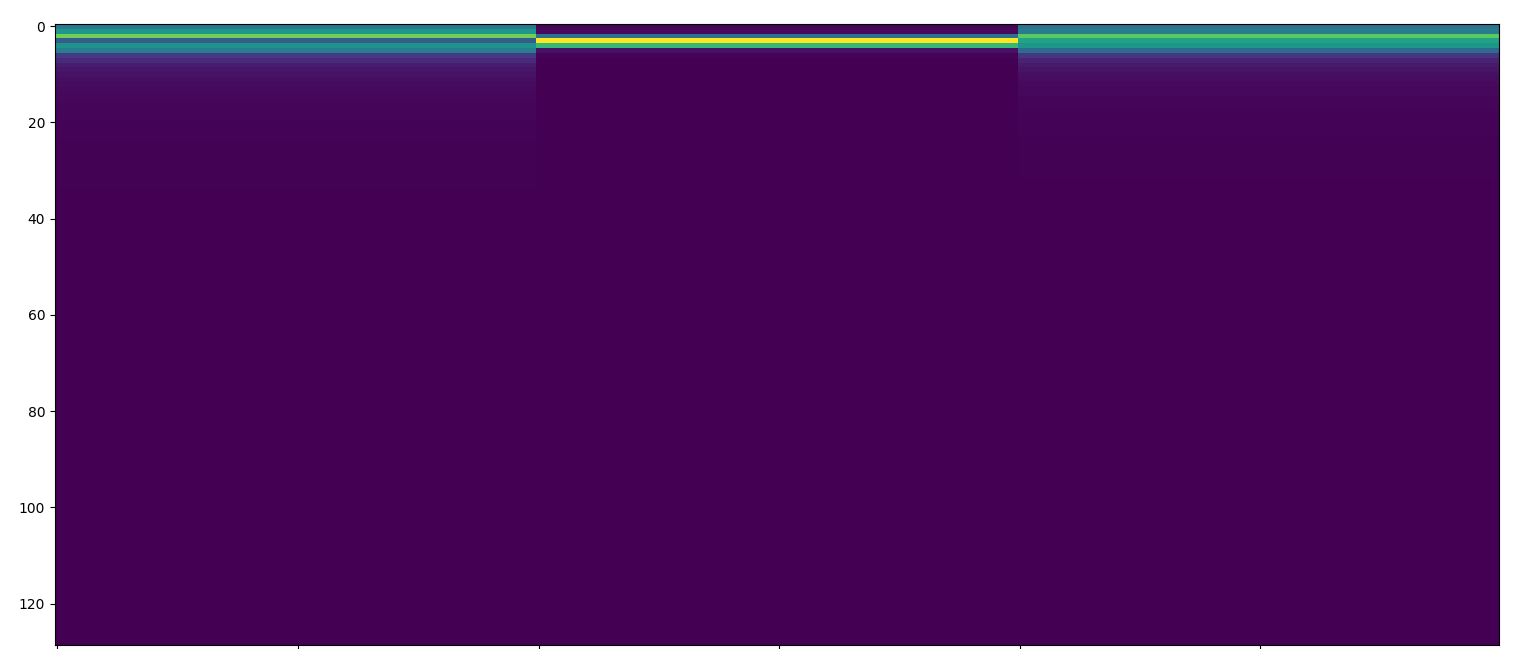
As you see, the sin wave only has a frequency 5 Hz, so I expect the output does not change in different time bins, but I got the following figure which is so strange:
I believe this is wrong, so I decided to used the signal library to get Spectrogram of the mention sin wave as follows:
frequencies_samples, time_segment_sample, spectrogram_of_vector = signal.spectrogram(
x=y,
fs=fs,
nperseg=256,
noverlap=184,
window=“hamming”,
detrend=False,
mode=‘magnitude’)
And, then by using signal.spectrogram, I get the following figure:
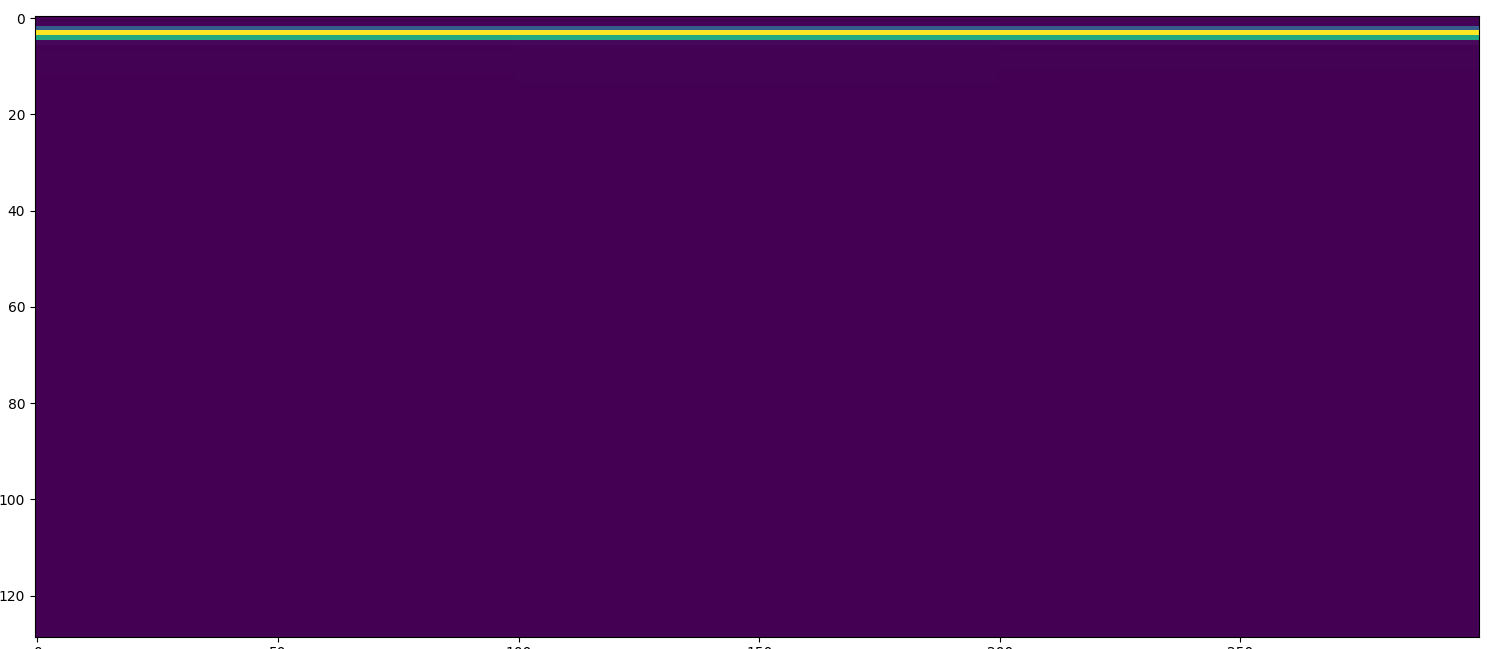
As we expected, the spectrogram should not change in different time bins because we have only one frequency.
So, what is the matter with the spectrogram when I use torch library? why it changes over the time when I have only one frequency?