Hi everyone,
I am building TraceML, an open-source tool for always-on step-level training visibility in PyTorch.
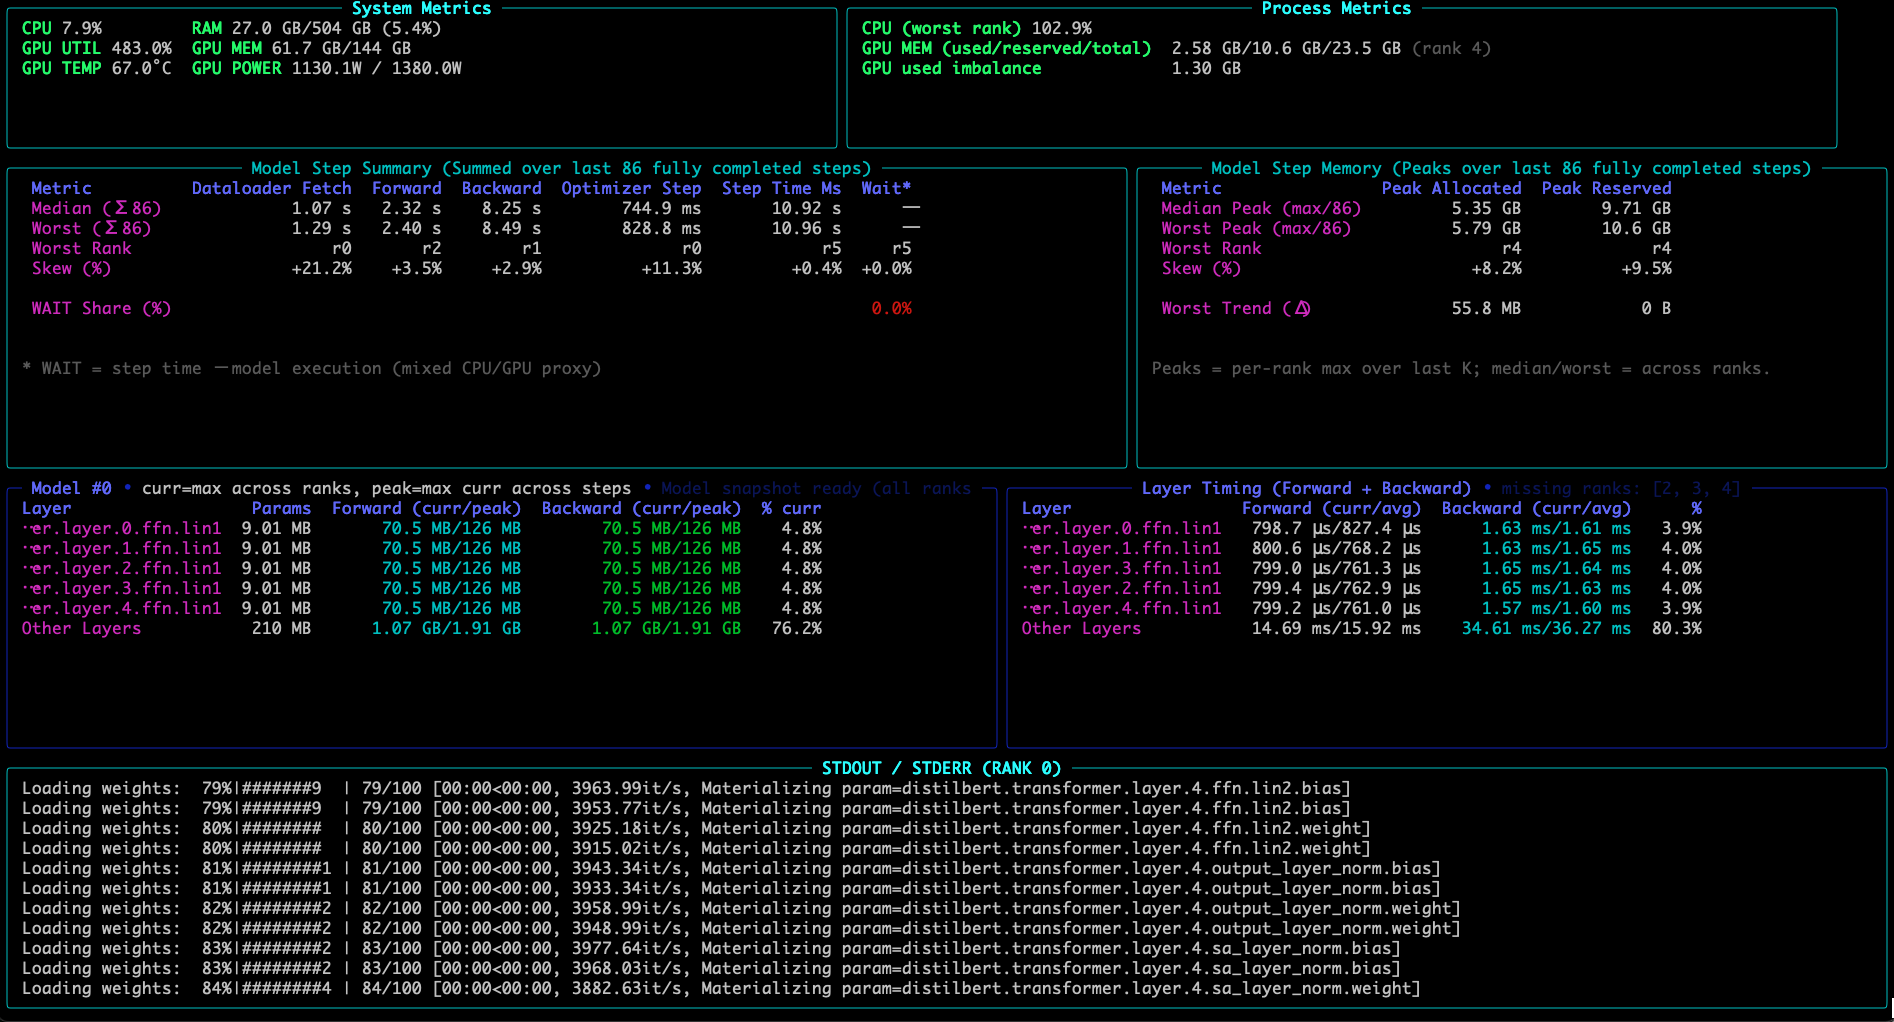
It shows where time and memory go inside each training step while training is still running, making it easier to spot bottlenecks, straggler behavior, and drift without jumping straight into a full profiling workflow.
Current support: Single GPU and Single-node multi-GPU (DDP)
TraceML surfaces:
-
dataloader fetch time
-
forward / backward / optimizer timing
-
step time
-
GPU memory (allocated + peak)
-
median vs worst rank in DDP (single node multiple GPU)
-
skew to highlight imbalance
-
compact end-of-run summary
Basic usage:
from traceml.decorators import trace_step

for batch in dataloader:
    with trace_step(model):
        outputs = model(batch["x"])
        loss = criterion(outputs, batch["y"])
        loss.backward()
        optimizer.step()
        optimizer.zero_grad(set_to_none=True)
Run with:
traceml run train.py
It opens a terminal dashboard alongside the training logs, and prints a summary card at the end.
TraceML is NOT meant to replace PyTorch Profiler or Nsight. It is focused on lightweight, practical visibility during real training runs and crisp end-of-summary.
Repo: GitHub - traceopt-ai/traceml: Lightweight training runtime health monitor · GitHub
PyPI: traceml-ai · PyPI
I would really appreciate feedback from the community, especially on: whether the surfaced signals are the right ones, missing workflow support and where this is useful vs not useful