My goal is being able to adjust the backend of distributed functions according to requirements. For example, I wish to be able to change a failed GPU to be substituted with a constant value tensor during any collective operation.
I experimented with running 2 GPUs with Megatron-LM and NCCL backend. I Intentionally caused a deadlock in one of them (i.e., while(True)) after 50 iterations. I then used py-spy to capture the call stack of the other GPU, expecting to observe collective operation such as a hanging all-reduce , and subsequently find the entry point and adjust the code as I wanted.
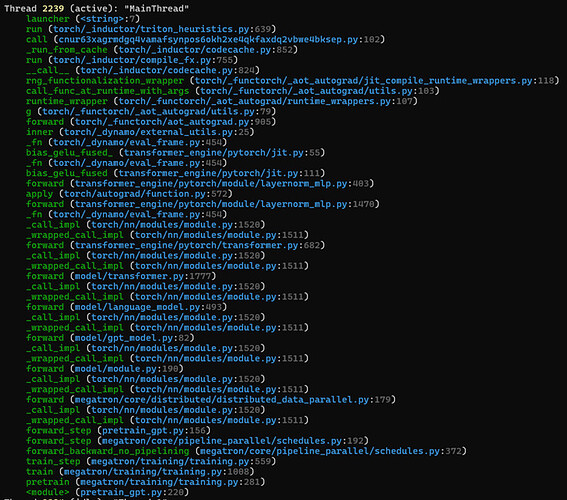
Instead, what I found was a complex stack that involves many wrappers, kernel fusion, Just-In-Time (JIT) compilation, and Triton which I’m not that familiar with but no collective operation:
But when waiting enough time during the deadlock I did encounter a timeout in a collective operation. Which came from a CPP file (ProcessGroupNCCL) which was not mentioned in the call stack(Couldn’t add a picture due to 1 item limitation)
I’m uncertain about how to proceed in my attempt to locate the entry point for the collective operation. Although I attempted to research JIT and Triton, the information is quite overwhelming. I’d really appreciate your help with this.
