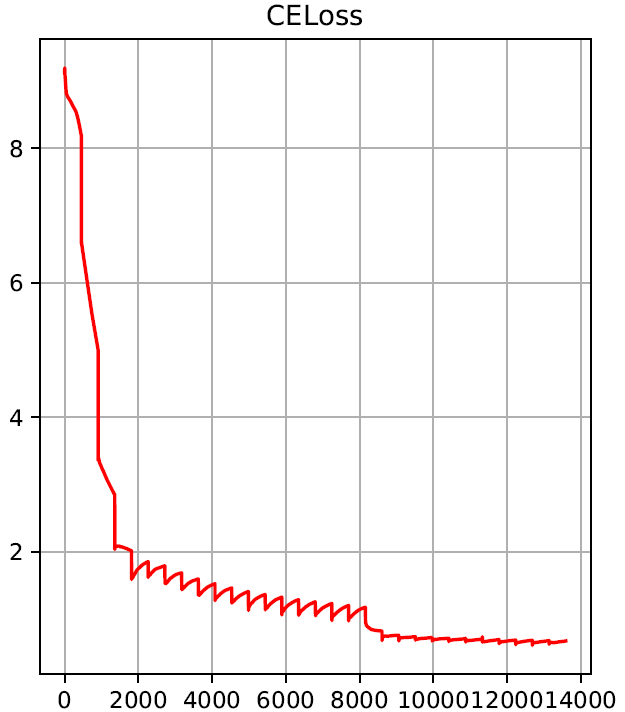
Do you plot the loss of the current batch or are you somehow summing / averaging it?
Could you post the code regarding the accuracy and loss calculation?
Especially since you are shuffling the data.
I couldn’t find any issues by skimming through your code.
Do you see the same effect by just storing the batch losses (without AverageMeter)?
Didn’t go through your code, but in general a possible cause for this type behaviour could be a feature set that isn’t normalised properly.
For example one of the features isn’t normalised at all and has for example values between 0 and 255. This causes the changes to the weights by the optimiser to overshoot when applied to this feature and it is not going in a more straight line to the optimum (hence the zigzag).
I assume at around 8000 iterations you reduce the learning rate and the changes to the weights are reduced and so is the “overshoot” factor (so smaller zigzag).
I am having the same zig-zag-ed loss values in one of my works.
In that work, I am dealing with multi-label (multiple hot encoder) of size 600.
I think this rather large multi-hot binary output is the reason for this zig-zag-ness.
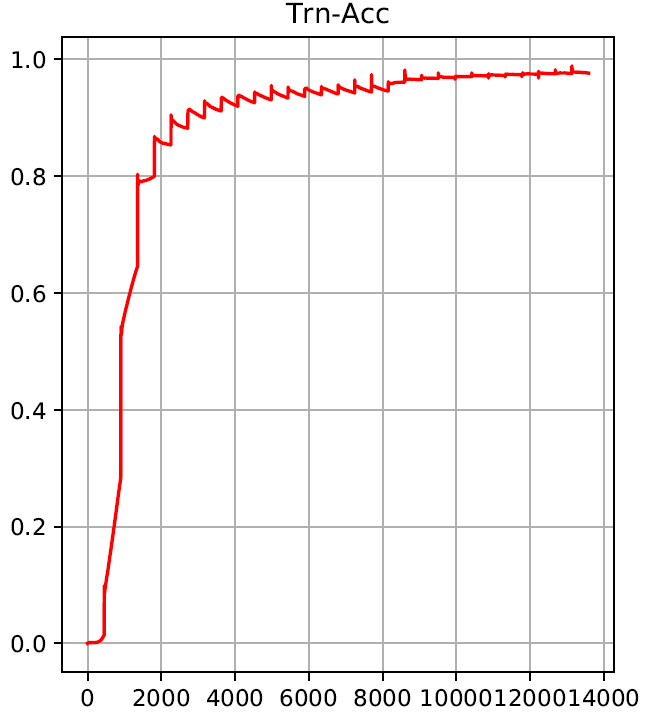
So, the large variations in the input/output could be the reason for this phenomenon. I would not worry about it as long as the model is achieving convergence.