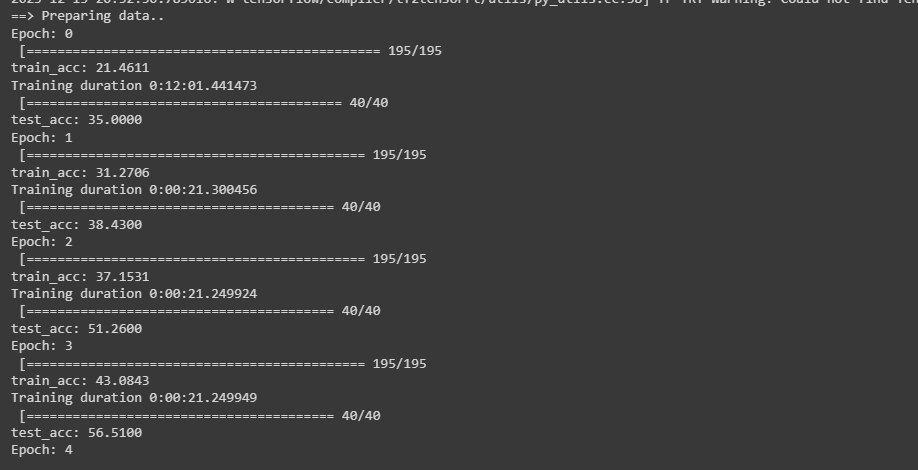
Ass you can see at the image, i have problems with the training of the model. The first epoch took while to long.
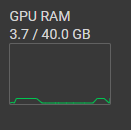
And my second Problem is, that i just use 3.7 GB of possible 40 GB GPU. #
I try to take more and less worker and set a higher and lower batch size but it dont help to use more gpu power.
The reason for the first epoch taking so long is probably that you are redownloading the dataset each time. Is this training session on your own computer or cloud hosted?
If you want to see the memory footprint increase, you’ll need a much larger batch size, something like 2k+ images per batch. You might even be able to fit the entire dataset on the GPU and still have room to spare. CIFAR images are only 32x32 with 3 channels, which is around 3kB per image.
it is cloud hosted i am using google colab and it has consumed too many resources so i need to optimize the code so that it can train fast. I even have the premium version and it takes between 4-5 hours to train a model. It only uses 3-4 GB of the GPU, but I haven’t found a way to optimize it yet…
How many epochs are you letting it run? Your picture earlier shows ~21 seconds per epoch.
Regarding the batch size, you’d have to experiment to see what the max is given the model, optimizer, data size, etc. But that’s not necessarily going to speed anything up for the following reasons:
You may have a bottleneck elsewhere, such as the num_workers of the dataloader;
A GPU has processing cores and RAM. The number of cores often determine how quickly the calculations are performed. You can think of all the calculations on a given batch like a pile of dirt. And the number of cores is the size of your shovel. Increasing the pile of dirt size doesn’t mean you’re shoveling any faster. For that, you need a bigger shovel.
One other way you might speed things up is to put your data and model into bfloat16. That will cut the size in half and speed up the calculations at a very insignificant loss in precision(which isn’t important for ML, anyways).
I let it run for 200 Epochs. The duration of one epoch depends on the Attack which i use. Short info its a big Project where i compere some ML Attacks and Defenses on a CIFAR-10 Dataset. Its a existing git Repo. The problem is i need it for my project in university. Next to me 4 other people try to optimize it but unsuccessful.
I really dont know how i can optimize it. so that’s the reason why i start this threat. I just startet with pythorch sice 1,5 months
If you have colab pro, I would recommend running nvidia-smi in console while letting the code run in notebook. Then you can see if your model utilized all GPU computational capacity to decide where the bottleneck is.