johnorford
August 18, 2023, 9:28am
1
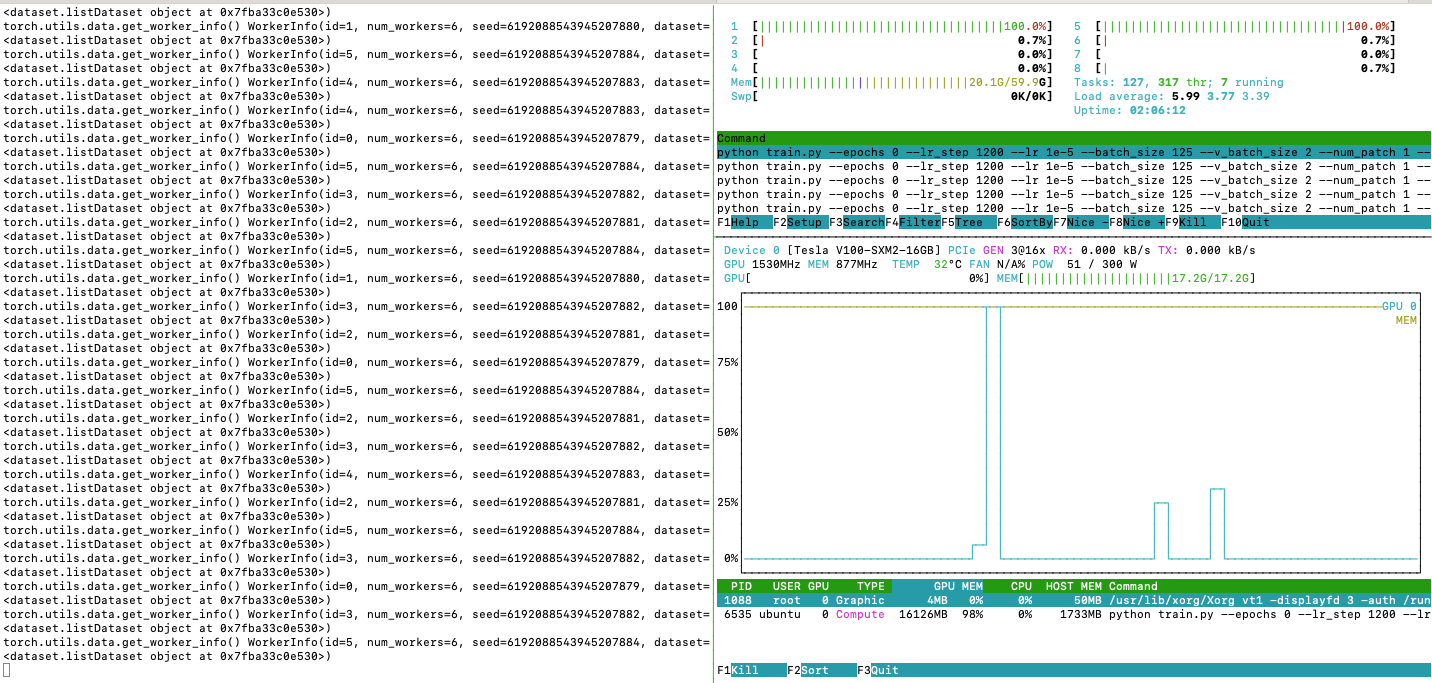
While training, I generally only use 2 CPUs at 100% utilisation (8 available). GPU utilisation is very low.
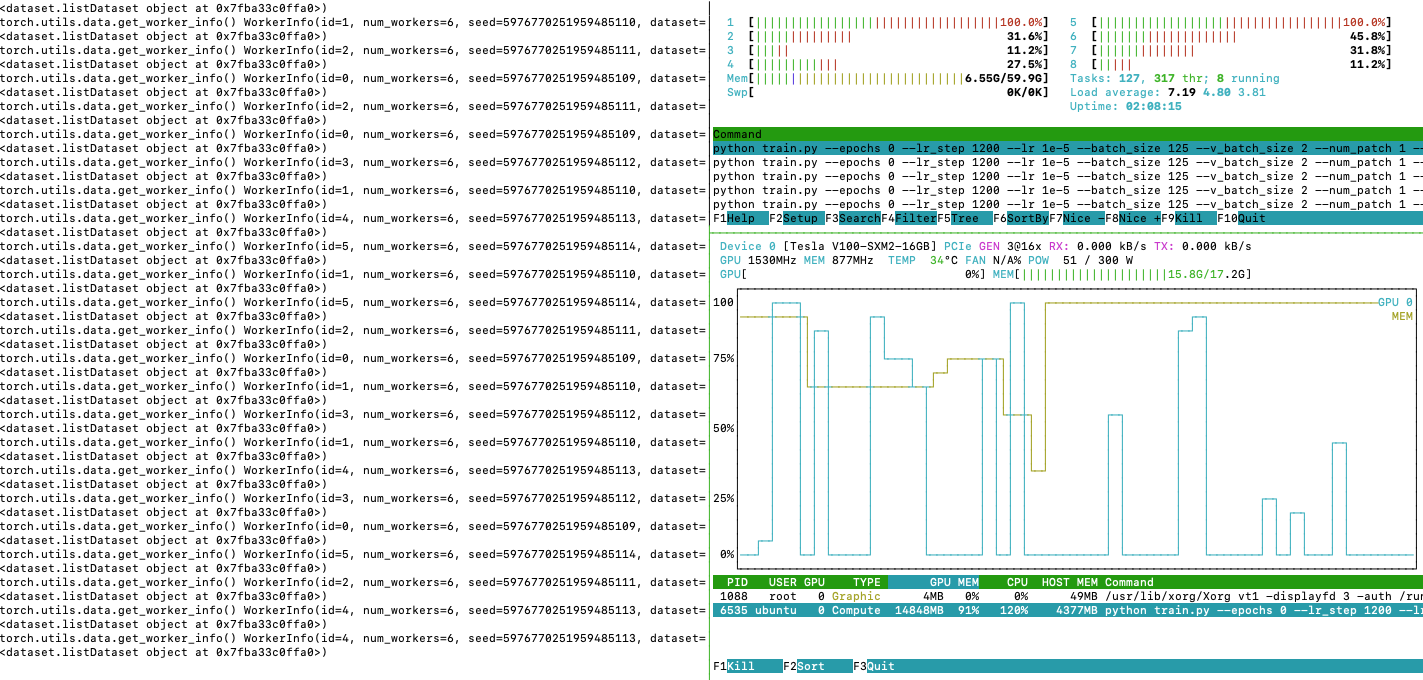
During validation, all CPUs are mostly used, and GPU utilisation is much higher.
During training, I:
set workers to 1 (only one CPU is used), 2 (2 CPUs are used) and 3 or more (mostly, no more than 2 CPUs are used both 100%)
printed torch.utils.data.get_worker_info(). For example, I see the 8 worker IDs s expected. But they seem to be just on two CPUs
I suspect I am missing something obvious…
There must be some difference in __get_item__ (same function, but training of course does some augmentation…)…
Training:
Validation:
Hi @johnorford ,
Have you used the torch.set_num_threads function to change the number of threads used for intraop-parrallelism? A bit of advice, don’t max out the number of threads being used, it’s best to leave 1 or 2 free. Docs here: torch.set_num_threads — PyTorch 2.0 documentation
You can see how many threads you’re using at the moment with torch.get_num_threads for reference. Docs here: torch.get_num_threads — PyTorch 2.0 documentation
There’s also some docs on optimizing the number of threads here too: CPU threading and TorchScript inference — PyTorch 2.0 documentation
johnorford
August 18, 2023, 11:40am
3
Thanks.
By default num_threads for me was 4. I set it to 8 and 16 and did not see any difference.
(I also double checked, by printing the num_threads…)
johnorford
August 21, 2023, 8:50am
4
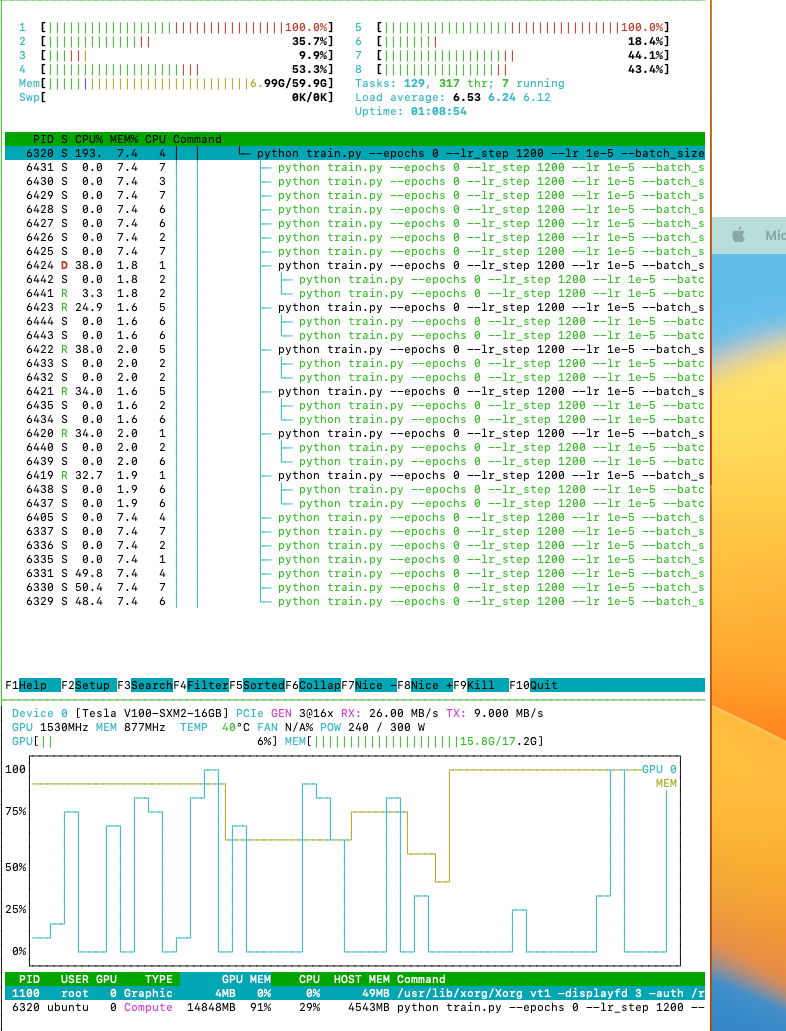
After some more investigation.
It seems to me that the data preparation part of the the data loader worker is just being run on two cores.
More details below…
I checked where each process is running.
Both validation & training:
6 workers
6 processes (always running on cores 2 & 5) with 2 children
6 processes evenly utilise the two cores (33% each)
When data is loaded into GPU, then I see other cores activated (more obvious during validation)
Training:
Lower GPU %, sending to GPU less often
I assume the two cores that are activated are loading data prior to sending to GPU
Validation:
Loads data into GPU more often
when data is loaded into GPU (i.e. you can see GPU utilisation also) then remaining cores are activated
johnorford
August 21, 2023, 5:11pm
5
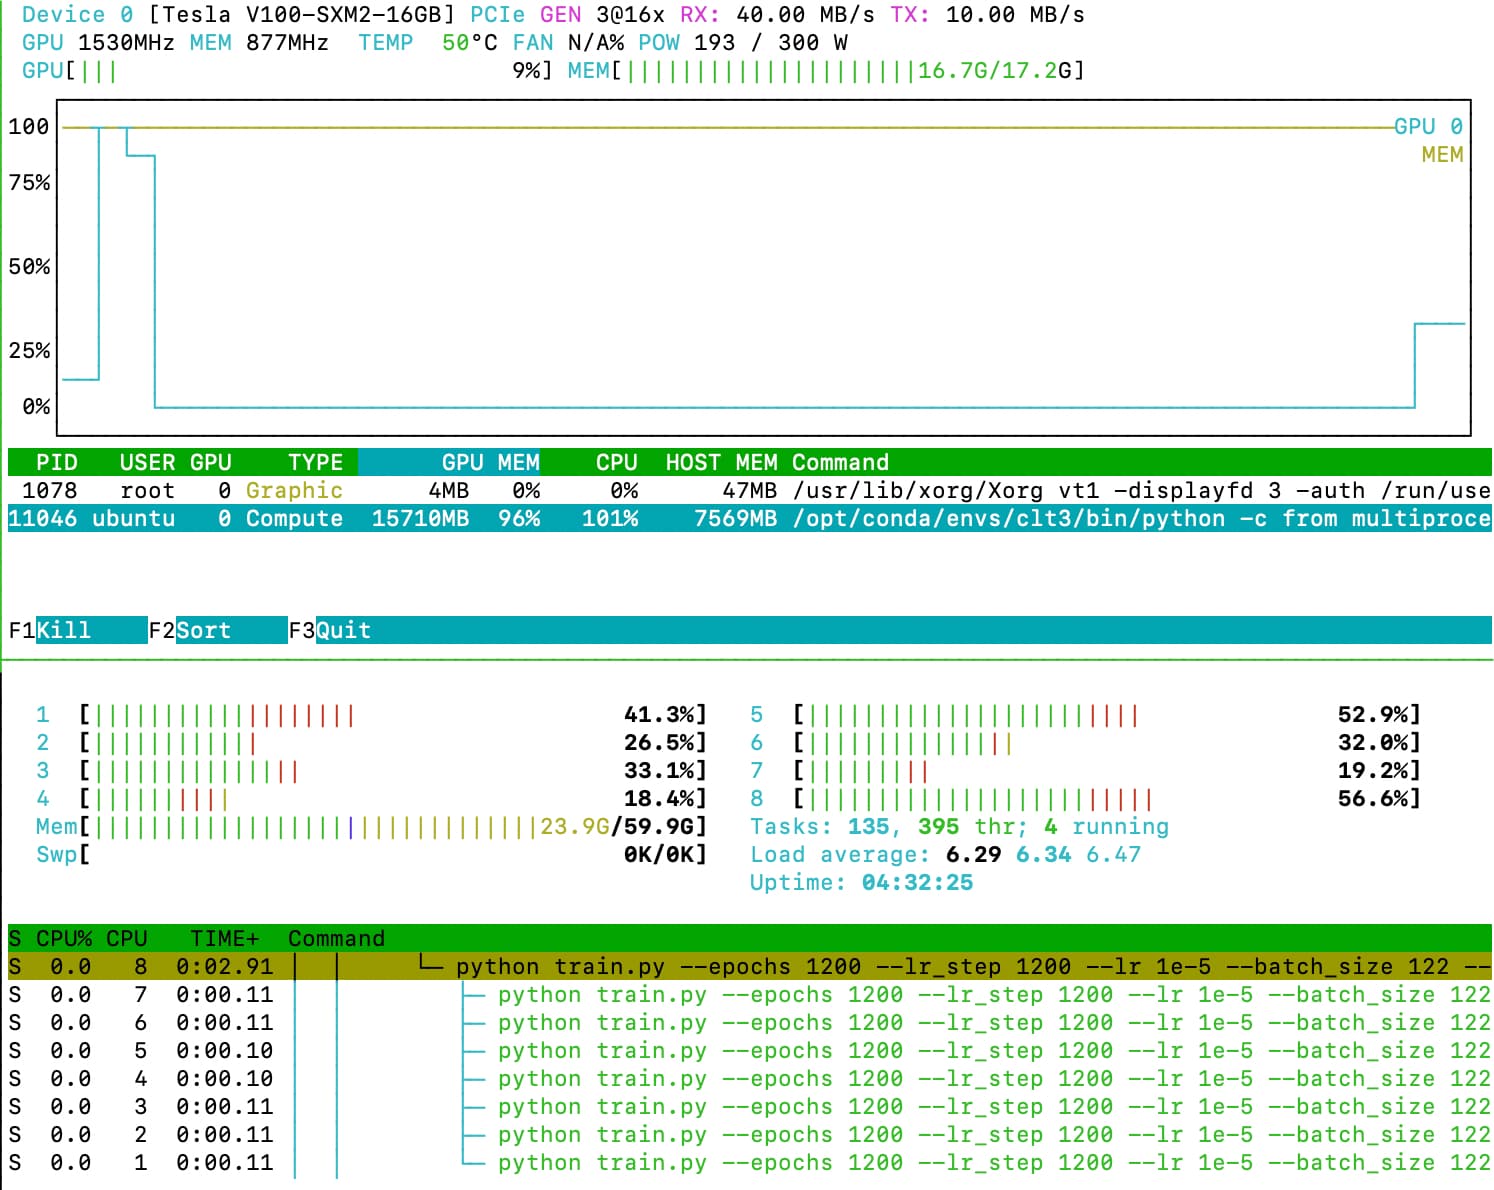
I ended up wrapping the model in DistributedDataParallel:
An epoch that took 4 minutes is now taking about 3 minutes.
Not bad. Probably still not optimal.
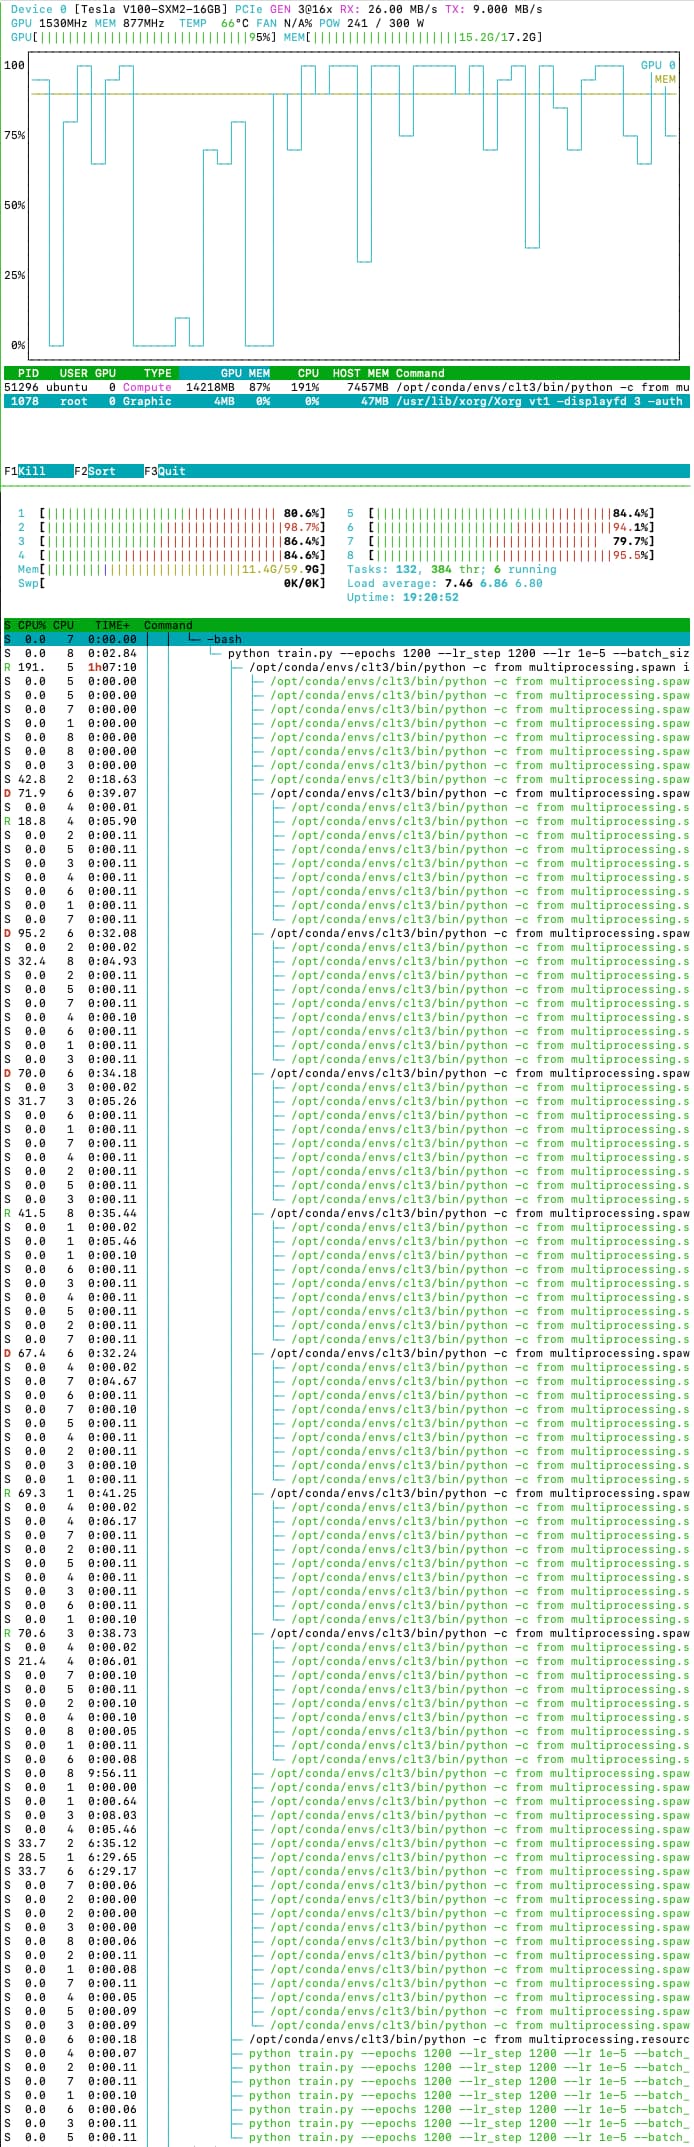
The DDP module
It looks like the default data loader uses some more complicated way of distributing things, but DDP looks much simpler (compare the HTop outputs).
No more bottlenecks with two cores.
Suspect disk IO is the next bottleneck.
johnorford
August 22, 2023, 8:00am
6
Finally, I reduced the batch size by a lot, and now utilisation of CPUs and GPU is far high.
Epoch time is now down to ~1.5 minutes (from 4 minutes originally).
@johnorford what program/command line utility are you displaying in these screenshots? It looks highly useful