Hi all,
I am facing an issue when training an autoencoder on CPU (I am designing a lab for students to be made on a platform with no GPU, but the problem I will describe does not happen on GPU).
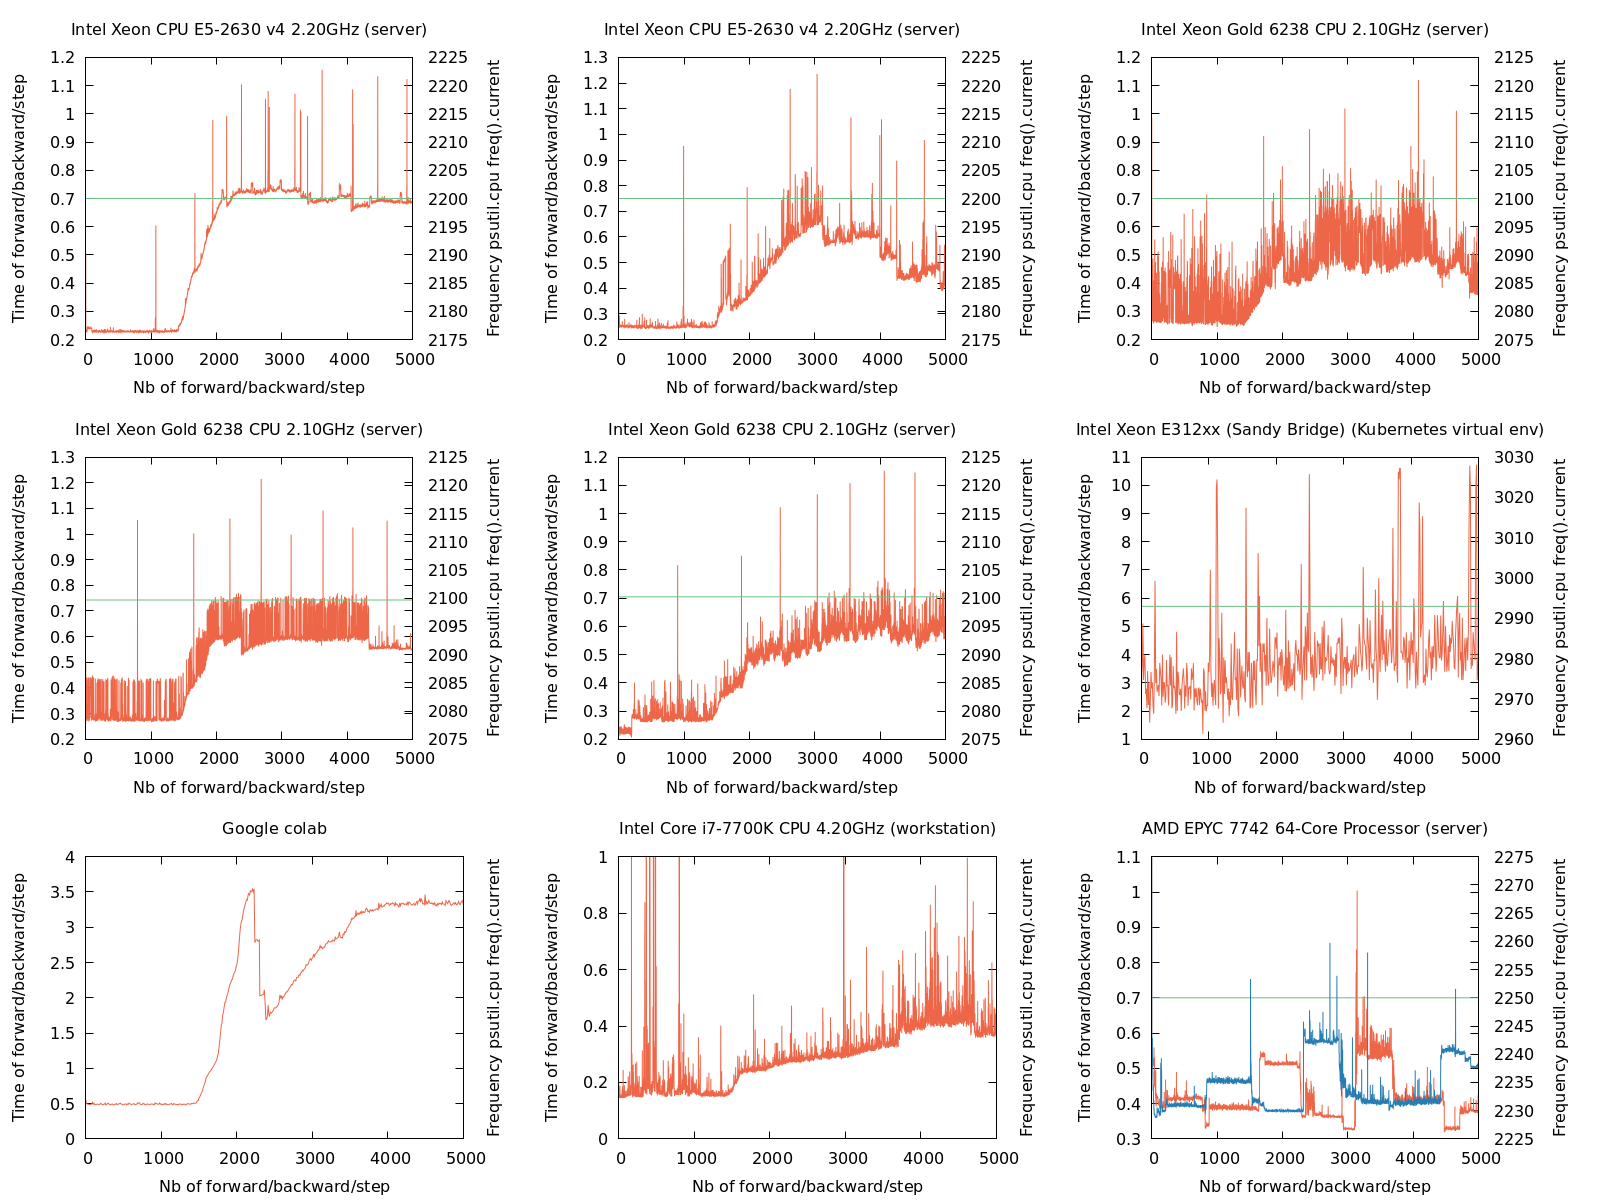
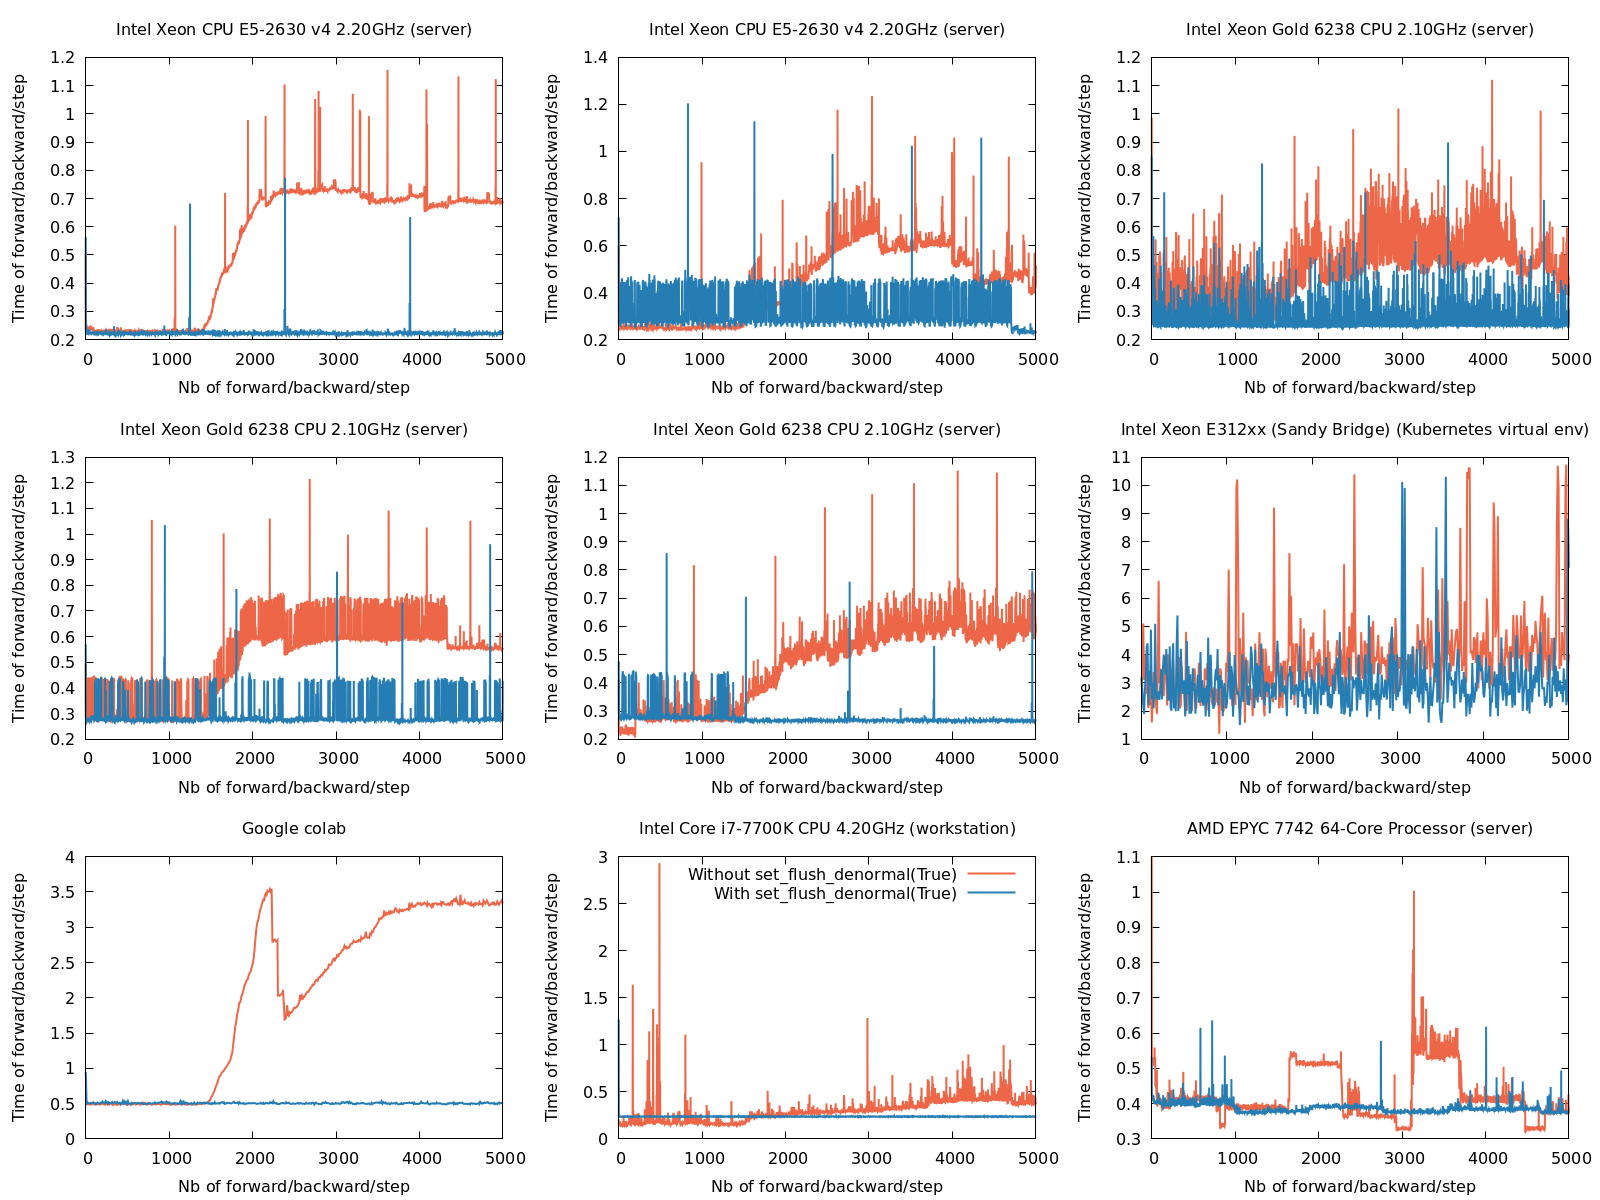
After some point, the time of an epoch starts increasing a lot. I provide a minimal working example code to reproduce the issue. At the beginning, the loop “get the batch, forward, grad, and optim step” takes 0.25 seconds, and after some time, it can be 2 or 3 times higher. This is what the graph below shows:

I tried many things including:
- call
del batch, lossandgc.collect()as suggested here I run out of memory after a certain amount of batches when training a resnet18 - #2 by smth - Remove variables which could keep computational graph in memory as suggested here Training gets slow down by each batch slowly - #21 by yqwang In particular, I removed statements like
total_loss += loss.item()just in case that would not detach the loss from the graph, also removednn.MSELoss(), the initial data-loader, and in the code below I used a random tensor as a minimal working example, but the problem started with a “real” data set. - The closest issue I found is Why the training slow down with time if training continuously? And Gpu utilization begins to jitter dramatically? - #4 by Musoy_King but was related to CUDA.
- I commented out the
optimizer.step()and the issue disappeared, but obviously the model is not training anymore. - use powers of 2 in all parameters
The issue arises on “PyTorch 1.10.2 + CUDA 11.3”, on “PyTorch 1.10.2 cpu only” and on “PyTorch with CUDA 11.1 on Google colab”.
Here is a minimal working example to reproduce the issue:
# coding=utf-8

import argparse
import time
import gc
import torch
import torch.nn as nn

class AutoEncoder(nn.Module):
    def __init__(self, h=128, e=128):
        super().__init__()
        self.encoder = nn.Sequential(
            nn.Conv2d(1, h, 5, 1, 0), nn.ReLU(),
            nn.Conv2d(h, h, 5, 1, 0), nn.ReLU(),
            nn.Conv2d(h, h, 4, 2, 0), nn.ReLU(),
            nn.Conv2d(h, h, 3, 2, 0), nn.ReLU(),
            nn.Conv2d(h, e, 5, 1, 0),
        )
        self.decoder = nn.Sequential(
            nn.ConvTranspose2d(e, h, 5, 1, 0), nn.ReLU(),
            nn.ConvTranspose2d(h, h, 3, 2, 0), nn.ReLU(),
            nn.ConvTranspose2d(h, h, 4, 2, 0), nn.ReLU(),
            nn.ConvTranspose2d(h, h, 5, 1, 0), nn.ReLU(),
            nn.ConvTranspose2d(h, 1, 5, 1, 0),
        )

    def forward(self, x):
        x = self.decoder(self.encoder(x))
        return x

model = AutoEncoder(32, 32)
print(model)
optimizer = torch.optim.Adam(model.parameters(), lr=0.002, weight_decay=1e-4)
train_images = torch.randn(16384, 1, 32, 32)
for epoch in range(40):
    for i, batch in enumerate(train_images.split(64)):
        tic = time.perf_counter()
        output = model(batch)
        loss = 0.5 * (output - batch).pow(2).sum() / batch.size(0)
        optimizer.zero_grad()
        loss.backward()
        optimizer.step()
        toc = time.perf_counter()
        gc.collect()
        del loss, output, batch

        print(f"epoch {epoch} {i} took {toc-tic:.2f} seconds")
Again, I have cleaned the code to show the issue. Do you have any idea? As I am designing a lab for students, I would like to avoid hacks like “reload the model every epoch to keep the training fast”.
Thanks for your help.