this may be a bit of a random question but it relates to the inputs i want to give to my neural network. Does anyone know how to create a 2 dimensional lognorm distribution, and then visualizing it as a 3d surface plot in python? i need to do this to understand a component of my network, any help is gratefully appreciated,
honestly any help would be great, i am seriously stuck at this point…
first you need to create a function logNoraml(x,y) that returns the value.
Then using matplotlib module like this example
from matplotlib import pyplot as plt
import numpy as np
from mpl_toolkits.mplot3d import Axes3D

fig = plt.figure()
ax = Axes3D(fig)
X = np.arange(-4, 4, 0.25)
Y = np.arange(-4, 4, 0.25)
X, Y = np.meshgrid(X, Y)
R = np.sqrt(X**2 + Y**2)
Z = np.sin(R)

ax.plot_surface(X, Y, Z, rstride=1, cstride=1, cmap='rainbow')

plt.show()
Please test this script first, then you need to edit R = logNorm(X, Y), finally ax.plot_surface(X, Y, R, ...)
1 Like
thank you for your reply, that approach makes alot of sense but im confused as to how i would create the function that would return the lognorm for an x,y position. could you lend some help in that regard? i understand how to visualize it its just i dont know how to create that function
dx = 90 - (-90)
dy = 90 - (-90)
c = [dx + dx/2.0, dy+dy/2.0]
z = np.zeros((400, 400))
x = np.linspace(-90, 90, 400)
y = x.copy()
for i in range(len(x)):
for j in range(len(y)):
p =[x[i], y[j]]
d = math.sqrt((p[0]-c[0])**2 + (p[1]-c[1])**2)
t = d
z[i][j] = lognorm.pdf(t, 1.2)
fig = plt.figure()
ax = fig.add_subplot(111, projection = '3d')
ax.plot_surface(x,y, z, cmap = 'viridis')
plt.show()
``
this is the code that i have so far, but it produces an image like the one that i have attached. this isnt what id like, the whole plane is skewed rather than just the z vlaues. any ideas as to how i can fix this? 
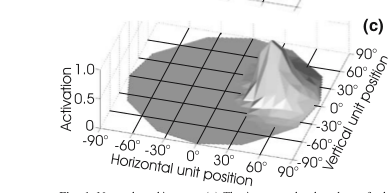
ideally i’d like it too look something like the attached image. Any help from you smart people is highly highly appreciated, im in a bit of time crunch with this
Sorry for reply you late.
I can draw figure like this
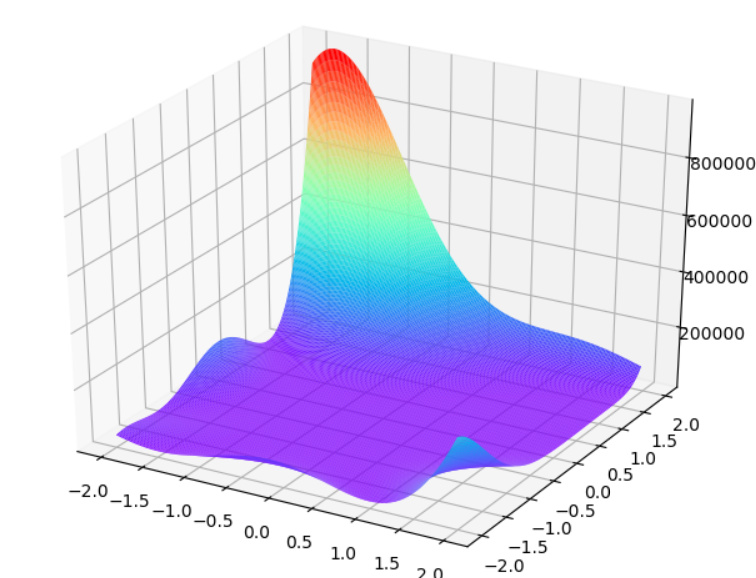
using code
import numpy as np
import matplotlib.pyplot as plt
from mpl_toolkits.mplot3d import Axes3D
import copy

def Goldstein_price(x,y):
    '''
        range: [-2, 2]
        f(0,-1)=3
    '''
    A = (1+ ((x+y+1)**2) * (19-14*x + 3*(x**2) - 14*y + 6*x*y + 3*(y**2) ))
    B = (30+ ((2*x-3*y)**2) *(18- 32*x + 12*(x**2) + 48*y -36*x*y + 27*y**2))
    return  A*B

def main():
    max_rg=2
    num = 200
    rg = np.arange(-max_rg, max_rg, float(max_rg)*2/num)

    result = draw(rg, Goldstein_price)

if __name__ == '__main__':
	main()
thank you!! how could i shift this such that the peak is at a different position say, (-0.5, 0)
if you want to draw the figure on horizontal space [-1, 1] (actually a square), you can change the max_rg to 1, and the num means how many point to draw from -1 to 1.
i understand that but can i shift it such that the peak value the highest z value is centered at a different position?
Yes you can, what you need to do is get two range for x and y, if you want to centralize on (-0.5,0) then y is range(-n, n), and x can be a range(-1, 0)
i see! thank you! would you mind plotting this using plt library i tried using your code and i get an error the draw() function
def draw(rg, func):
    fig = plt.figure()
    ax = Axes3D(fig)
    X = copy.deepcopy(rg)#np.arange(-5, 5, 5/100.0)
    Y = copy.deepcopy(rg)#np.arange(-5, 5, 5/100.0)
    X, Y = np.meshgrid(X, Y)
    R = func(X,Y)
    ax.plot_surface(X, Y, R, rstride=1, cstride=1, cmap='rainbow')
    plt.show()
    return R
The missing part of my code.
1 Like
thank you very much! you’ve been extremely helpful!
one final request, im very sorry for this. could you show me an exmaple of shifting the peak point to near the center of the distribution of the meshgrid? thank you very much!!
The code above draw a fig in range x[-2,2] and y[-2,2], I change it to x[-1, 1] and y[-2,2] by
editing the draw() like this:
X =  np.arange(-1,1,2/100.0)
Y = copy.deepcopy(rg)#np.arange(-5, 5, 5/100.0)
May this help you.
thank you, im going to try and use it but i still cant seem to shift the peak to the centre position, like this: