I am having trouble visualizing the predictions of a multi-class (4 classes) instance segmentation.
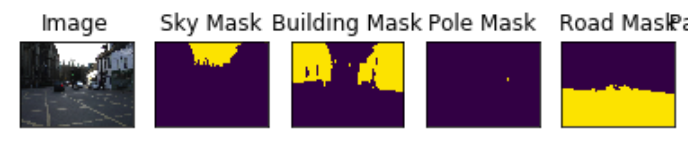
I can visualize the masks before the modeling like this but how could I do the same with the predictions?
CLASSES = ['sky', 'building', 'pole', 'road']
dataset = Dataset(x_train_dir, y_train_dir, classes= ['sky', 'building', 'pole', 'road'])
image, mask = dataset[4] # get some sample
visualize(
    image=image,
    #cars_mask=mask.squeeze(),
    sky_mask = mask[...,0].squeeze(),
    cars_mask = mask[...,1] .squeeze(),
    pole_mask = mask[...,2].squeeze(),
    road_mask = mask[...,3] .squeeze(),
)
Example output:
Visualizing predictions
for i in range(5):
    n = np.random.choice(len(test_dataset))

    image_vis = test_dataset_vis[n][0].astype('uint8')
    image, gt_mask = test_dataset[n]

    gt_mask = gt_mask.squeeze()

    x_tensor = torch.from_numpy(image).to(DEVICE).unsqueeze(0)
    pr_mask = model.predict(x_tensor)
    pr_mask = (pr_mask.squeeze().cpu().numpy().round())

    visualize(
        image=image_vis,
        ground_truth_mask=gt_mask,
        predicted_mask=pr_mask
    )
Oli
March 6, 2020, 9:25pm
2
You could create a palette image .
I think you can argmax predictions -> numpy() -> PIL Image.fromarray() -> set the image to pallette mode
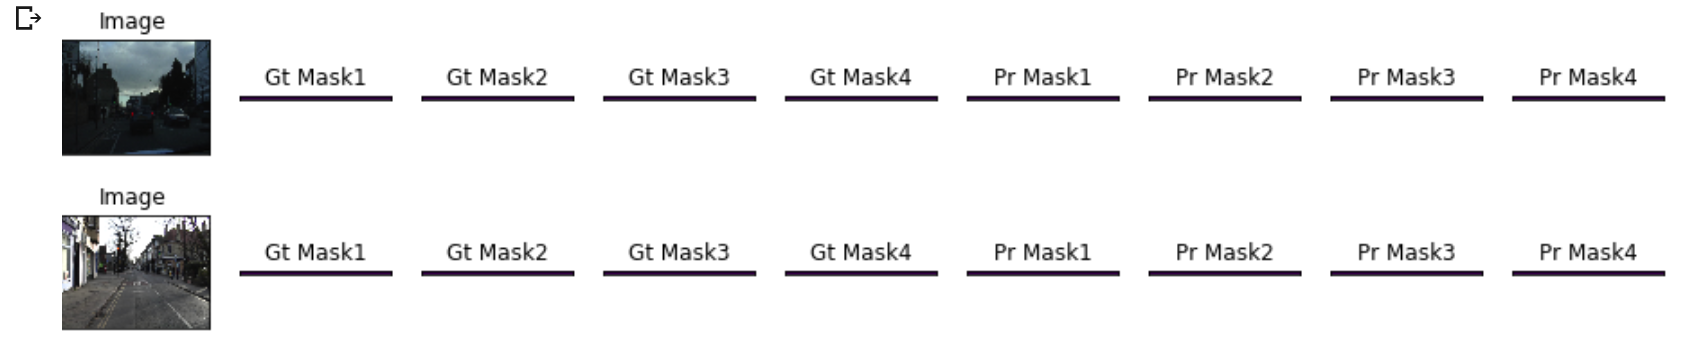
The following code seems to be working but ground truth and prediction mask images are condensed
. So weird.
for i in range(2):
    n = np.random.choice(len(test_dataset))
    image_vis = test_dataset_vis[n][0].astype('uint8')

    image, gt_mask = test_dataset[n]

    gt_mask1 = gt_mask[...,0].squeeze()
    gt_mask2 = gt_mask[...,1].squeeze()
    gt_mask3 = gt_mask[...,2].squeeze()
    gt_mask4 = gt_mask[...,3].squeeze()

    x_tensor = torch.from_numpy(image).to(DEVICE).unsqueeze(0)
    pr_mask = model.predict(x_tensor)

    pr_mask1 = (pr_mask[...,0].squeeze().cpu().numpy().round())
    pr_mask2 = (pr_mask[...,1].squeeze().cpu().numpy().round())
    pr_mask3 = (pr_mask[...,2].squeeze().cpu().numpy().round())
    pr_mask4 = (pr_mask[...,3].squeeze().cpu().numpy().round())


    visualize(
        image=image_vis,
        gt_mask1 = gt_mask1,
        gt_mask2 = gt_mask2,
        gt_mask3 = gt_mask3,
        gt_mask4 = gt_mask4,
        pr_mask1 = pr_mask1,
        pr_mask2 = pr_mask2,
        pr_mask3 = pr_mask3,
        pr_mask4 = pr_mask4
    )
# helper function for data visualization
def visualize(**images):
    """PLot images in one row."""
    n = len(images)
    plt.figure(figsize=(16, 5))
    for i, (name, image) in enumerate(images.items()):
        plt.subplot(1, n, i + 1)
        plt.xticks([])
        plt.yticks([])
        plt.title(' '.join(name.split('_')).title())
        plt.imshow(image)
    plt.show()
I had a similar problem a while ago. The parts that are condensed are actually because of some incorrect dimension/ coordinate when you are plotting.
You will need to recheck which channel should have which coordinate.