Are there any exiting implementations of understanding what it is learning in the networks. For example, weight visualization, “deconvolution” for visualization, gradient ascent, etc?
Thanks!
Are there any exiting implementations of understanding what it is learning in the networks. For example, weight visualization, “deconvolution” for visualization, gradient ascent, etc?
Thanks!
I dont think there exists a reliable all-in-one solution. For me I found visdom to be a good building block for visualization.
You can access model weights via:
for m in model.modules():
    if isinstance(m, nn.Conv2d):
        print(m.weights.data)
However you still need to convert m.weights.data to numpy and maybe even do some type casting so that you can pass it to vis.image.
Great, I have heard about visdom too.
I guess it will be a good further pull request of pytorch.  @Soumith_Chintala
Did you implement this already in visdom?
Not yet, planning too. Did you have any implementation?
@bodokaiser, are you sure the model.modules() nn.Conv2d instance has weights attribute?
Cause I tried to access the weights using your example and it returns
  self.weights = m.weights#.data
  File "/home/user/anaconda2/envs/py27/lib/python2.7/site-packages/torch/nn/modules/module.py", line 237, in __getattr__
    return object.__getattr__(self, name)
AttributeError: type object 'object' has no attribute '__getattr__'
The weights can be found via model.state_dict() and the values for layer weights can be extracted from the dictionary using model.state_dict()['name of key']
Not using visdom, but something I hacked together for this purpose (with an example for VGG):
import torch
import torchvision.models as models
from matplotlib import pyplot as plt
def plot_kernels(tensor, num_cols=6):
if not tensor.ndim==4:
raise Exception("assumes a 4D tensor")
if not tensor.shape[-1]==3:
raise Exception("last dim needs to be 3 to plot")
num_kernels = tensor.shape[0]
num_rows = 1+ num_kernels // num_cols
fig = plt.figure(figsize=(num_cols,num_rows))
for i in range(tensor.shape[0]):
ax1 = fig.add_subplot(num_rows,num_cols,i+1)
ax1.imshow(tensor[i])
ax1.axis('off')
ax1.set_xticklabels([])
ax1.set_yticklabels([])
plt.subplots_adjust(wspace=0.1, hspace=0.1)
plt.show()
vgg = models.vgg16(pretrained=True)
mm = vgg.double()
filters = mm.modules
body_model = [i for i in mm.children()][0]
layer1 = body_model[0]
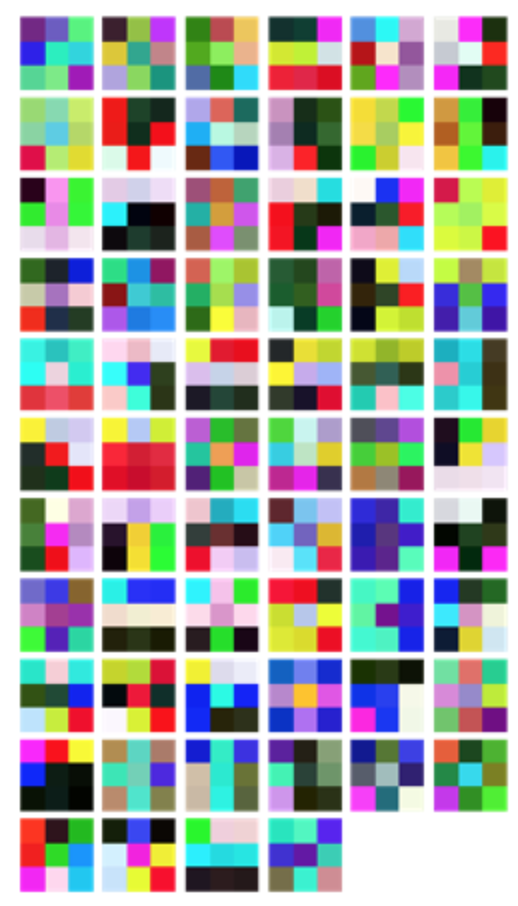
tensor = layer1.weight.data.numpy()
plot_kernels(tensor)Do you have the output of it?
@Fchaubard Interesting, so they are 3x3 filters?
yes vgg has 3x3 filters all over.
How can I implement visualization techniques like deconvolution, guided backprop?
I am working on it. May release some gist snippets in sometime. Would this be useful?
Yes. How are you going to do it? I’m planning to implement it using backward hooks. However, seems that, backward hook only takes the gradient as input, and for many visualization techniques, the original input and output are also needed.
One thing I can think of, is using both forward and backward hooks, and keeping all the input/output in some external dictionary.
@zym1010 Sorry for late reply. Oh, for salency map and class model optimization. It should be pretty easy. Guided backprop I have not invested into it yet. Backprop is just taking the gradient out, so I guess it’s fine.
I am going to create a repo (probably) to have some examples on saliency map and other. You want to work on it together?
Yeah. sure. Let’s work on this together.
My goal is to have something in PyTorch that is similar to https://github.com/yosinski/deep-visualization-toolbox, yet more flexible and powerful. The visualization code for custom networks, in the deep visualization toolbox is painful.
One reference I can think of, on saliency map stuffs, is https://github.com/Lasagne/Recipes/blob/master/examples/Saliency%20Maps%20and%20Guided%20Backpropagation.ipynb
@zym1010 Cool. I will open up a github repo in a new couple of weeks (probably). My goal at the beginning is to first show examples of how to implement several visualization algorithm such as saliency map, and eventually may develop a tool like the deep-visualization-toolbox (if there are enough time).
I’ve finished a rough re-implementation of that Lasagne example I’m talking about.
Check https://github.com/leelabcnbc/cnnvis-pytorch/blob/master/test.ipynb
I’ve double checked it against the Lasagne example, and they are exactly the same, except for some bug on the Lasagne/Theano side on my system, for deconv.
@johnny5550822 @zym1010 How to visualize of the image as the result of every convolution?, are you able to make like this . Or can we copy the Pytorch weight to caffe and produce the result?, do you have any suggestion?
-Thank you-