Understanding loss.backward() and cpu usage

I initially posted this on the pytorch developer forums because this is a general inquiry I was having in tandem with the nsys tool, but I think that’s the wrong place so hopefully this is better.

I have noticed that when profiling my networks with nsys, the cpu is always running 100% during loss.backward(). The graph looks similar to other profiles from this tool, which always seem to show activity on the cpu during loss.backward() (if I am reading nsys correctly). I was hoping someone could explain what is happening here, because I am trying to find bottlenecks in my routine as I don’t seem to be gettng expected performance boosts when increasing the batch size, using AMP, and so forth. It also doesn’t seem to matter whether I preload my data onto the gpu or use workers to transfer it from the cpu at runtime. In both cases, I only have appreciable cpu activity during loss.backward(). I was under the impression that if I preloaded all of my data and only retrieved shuffled batches at training time via, eg. torch.gather(), I would not be using the cpu at all. Any help? Thanks!

That’s not the case since the Python process is still executed on the CPU.
Besides the data loading and other CPU-related work the CPU is used to execute the actual script, schedule the CUDA kernels, etc.
Could you post the profile showing the unexpected CPU usage, please?

Thanks for the response. To be clear, I’m not sure if there is an issue here or not… I’m mainly trying to understand why I have such high cpu usage during the backward() call, particularly when all the data is on the gpu. I’ve attached a picture of the case with all the data preloaded on the gpu, 0 worker threads, followed by one where I have 2 worker threads that load the data into batches from the cpu. What confuses me is that I’d expect that in the second case we’d have some cpu activity during the batching (or in between batches) but in both cases I’m only seeing activity during backward(). So I’m sure I’m completely misunderstanding how this works. I am happy to provide more detail if you can help me out. Thanks

Data preloaded to GPU:

Data loaded from CPU->GPU via worker threads when batching:

Thanks for sharing the screenshots.
I’m a bit confused about your explanation as it seems the actual CPU workload is high during the forward and backward pass, which could indicate a CPU-limited workload. This could also result in the inability to run ahead with the kernel scheduling and you could check how far the kernel launches are away from the actual kernel execution on the GPU.

Yes, I think I was misreading this. According to the graph it’s maxing out the cpu the entire way through, no? What is the difference between the two cpu processes in forward/optimize vs backward? According to the label the first two are in the python process and the backward is in CUDA API? I do believe I am cpu limited here because when I have the tensors preloaded, I don’t get any sort of speed boost. But I’m not sure why I"m using so much cpu. The only thing I can think of that i’m doing funny is using a custom collate function during the batch retrieval. This takes roughly this format:

def collate(self,idxs): # == list of shuffled ids in this batch

device = self.device
idxs = torch.tensor(idxs,dtype=torch.int64,device=device)
E = self.E.gather(0,idxs)
return MyBatch(len(idxs),E)

When I set my num_workers to 0, device is always cuda, so with each new batch I’m creating a new subset tensor of the full data tensor on the gpu. I was under the impression that this would not be a cpu-intensive operation.

Perhaps I can post my full code tomorrow. I’m sure I’m doing something very inefficiently because none of the standard optimization tricks seem to improve my result. Even when I move to large batches I generally get the same or worse performance. Ditto for more workers. And AMP does not improve performance. So I probably have a separate bottleneck here. Thank you so much!

Hello again! The project I am trying to optimize is a little more complicated, so I decided to try some tests on a very simple project, specifically the well-known MNIST network. What I want to see is whether it too uses 100% cpu when running with 1) tensors preloaded to to the gpu and 2) worker-threads moving tensors from cpu to gpu. In my main project, I can fit all of the data on the gpu so I assumed that this was the fastest way to do things, but as I mentioned before, nothing I do seems to make a difference because it appears to be cpu-limited (and I’m not sure why).

With the MINST project, I do see more expected results. Preloading the tensors results in a long startup time and then a slightly faster per-epoch speed. But as I increase the #workers this speed gap becomes somewhat insignificant when compared to the cpu-to-gpu method (eg with 8 worker threads it’s almost the same). I’m assuming that at some point the gpu becomes the rate limiting step.

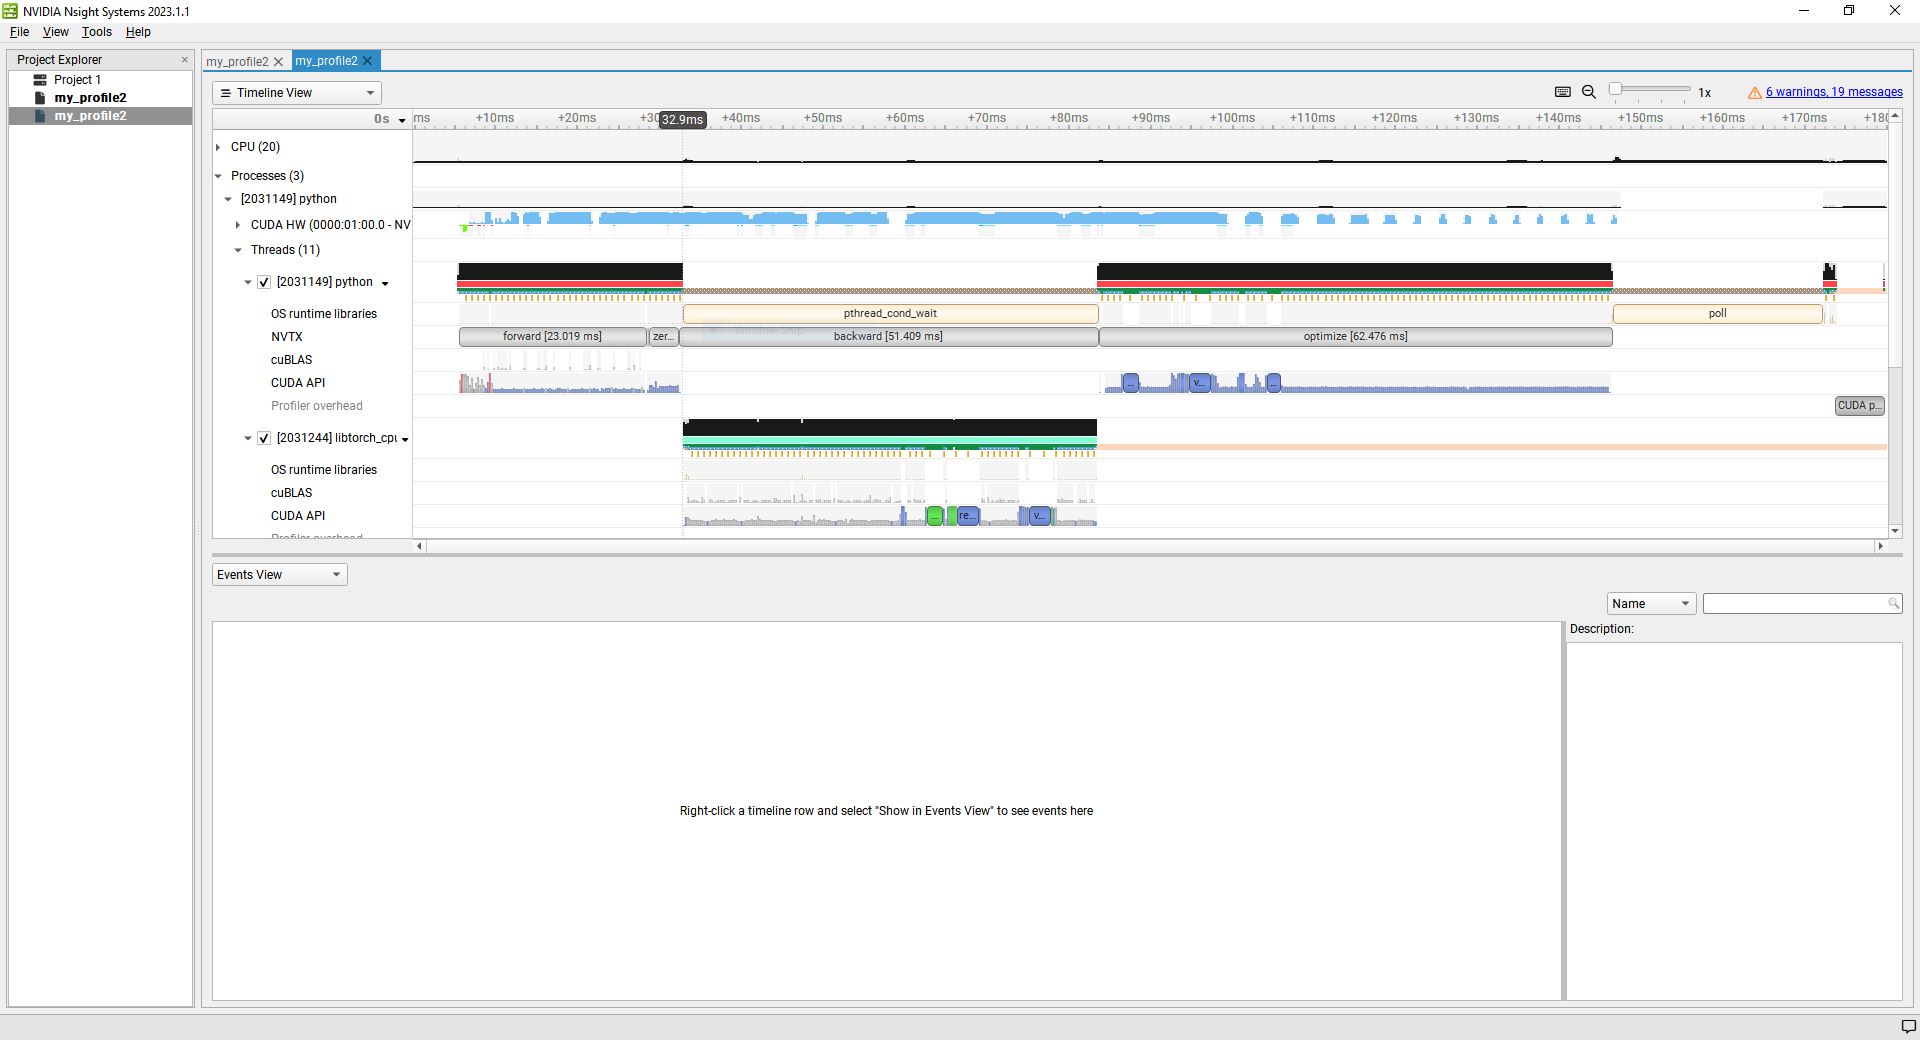
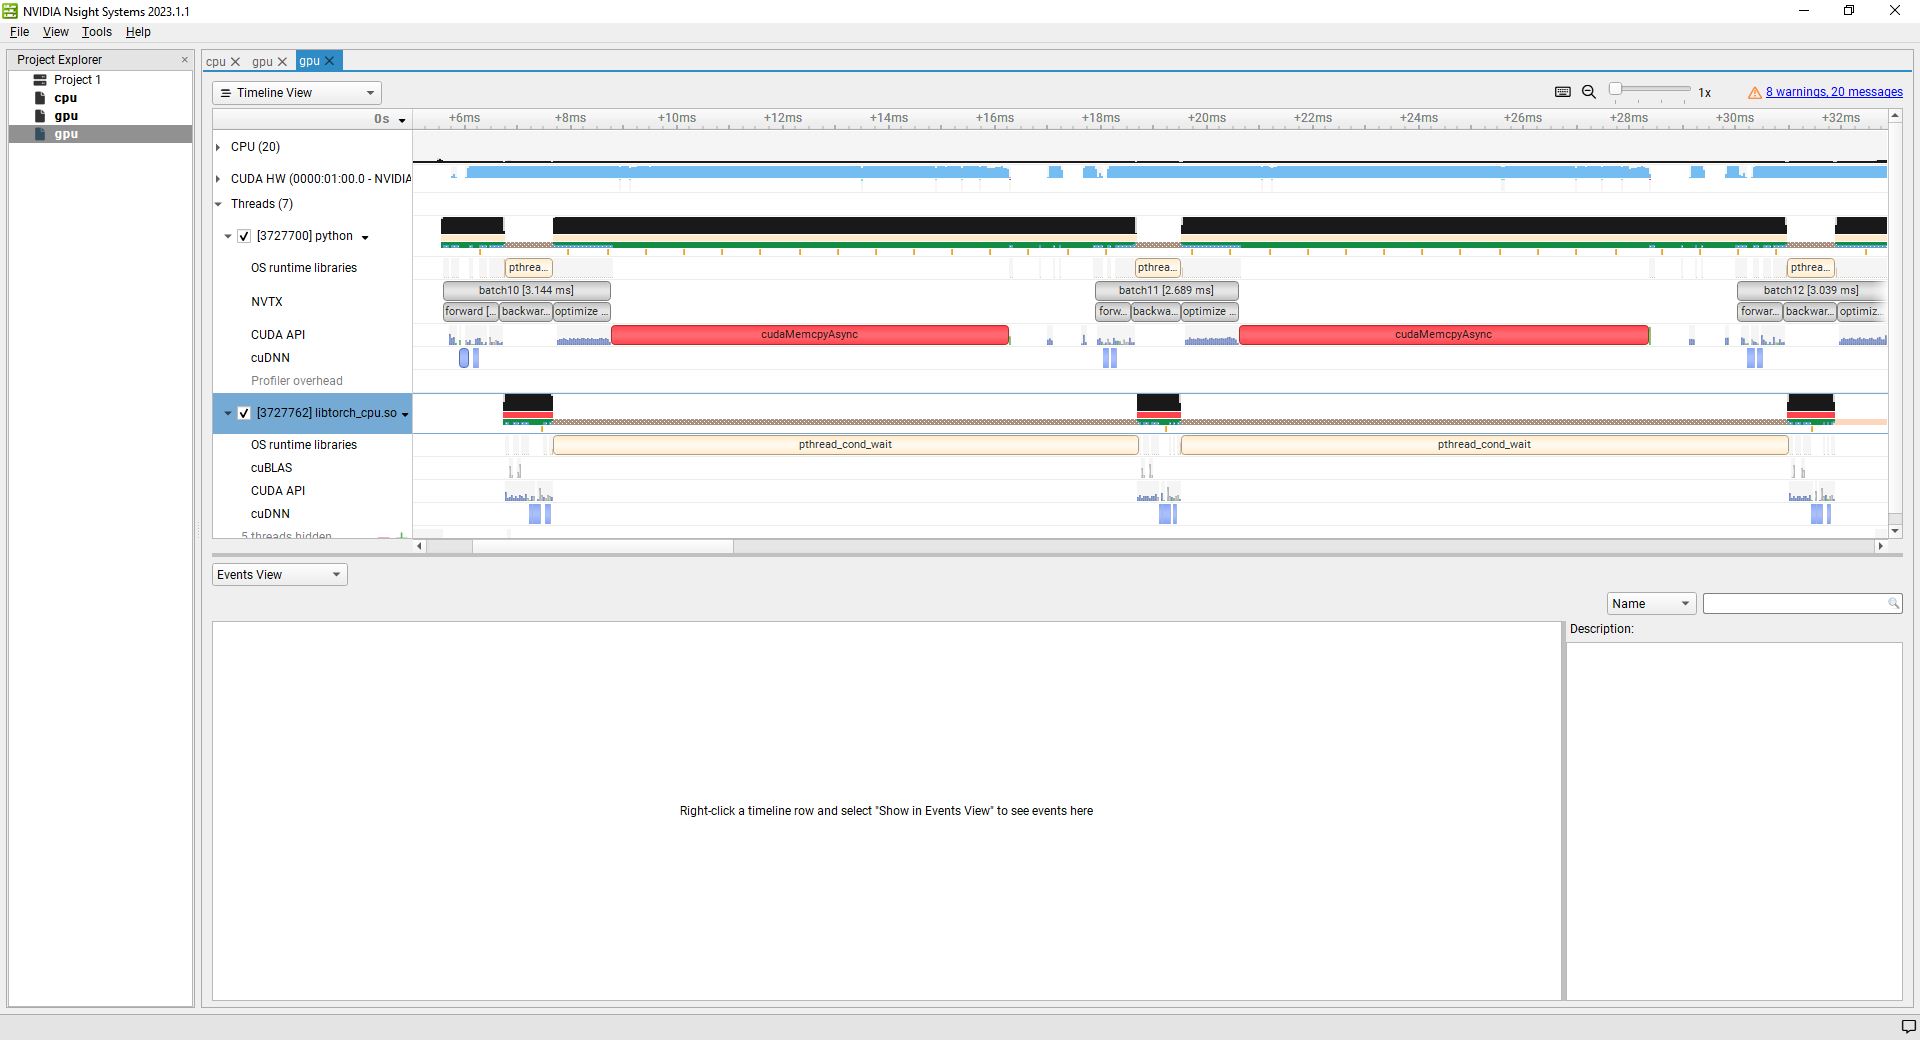
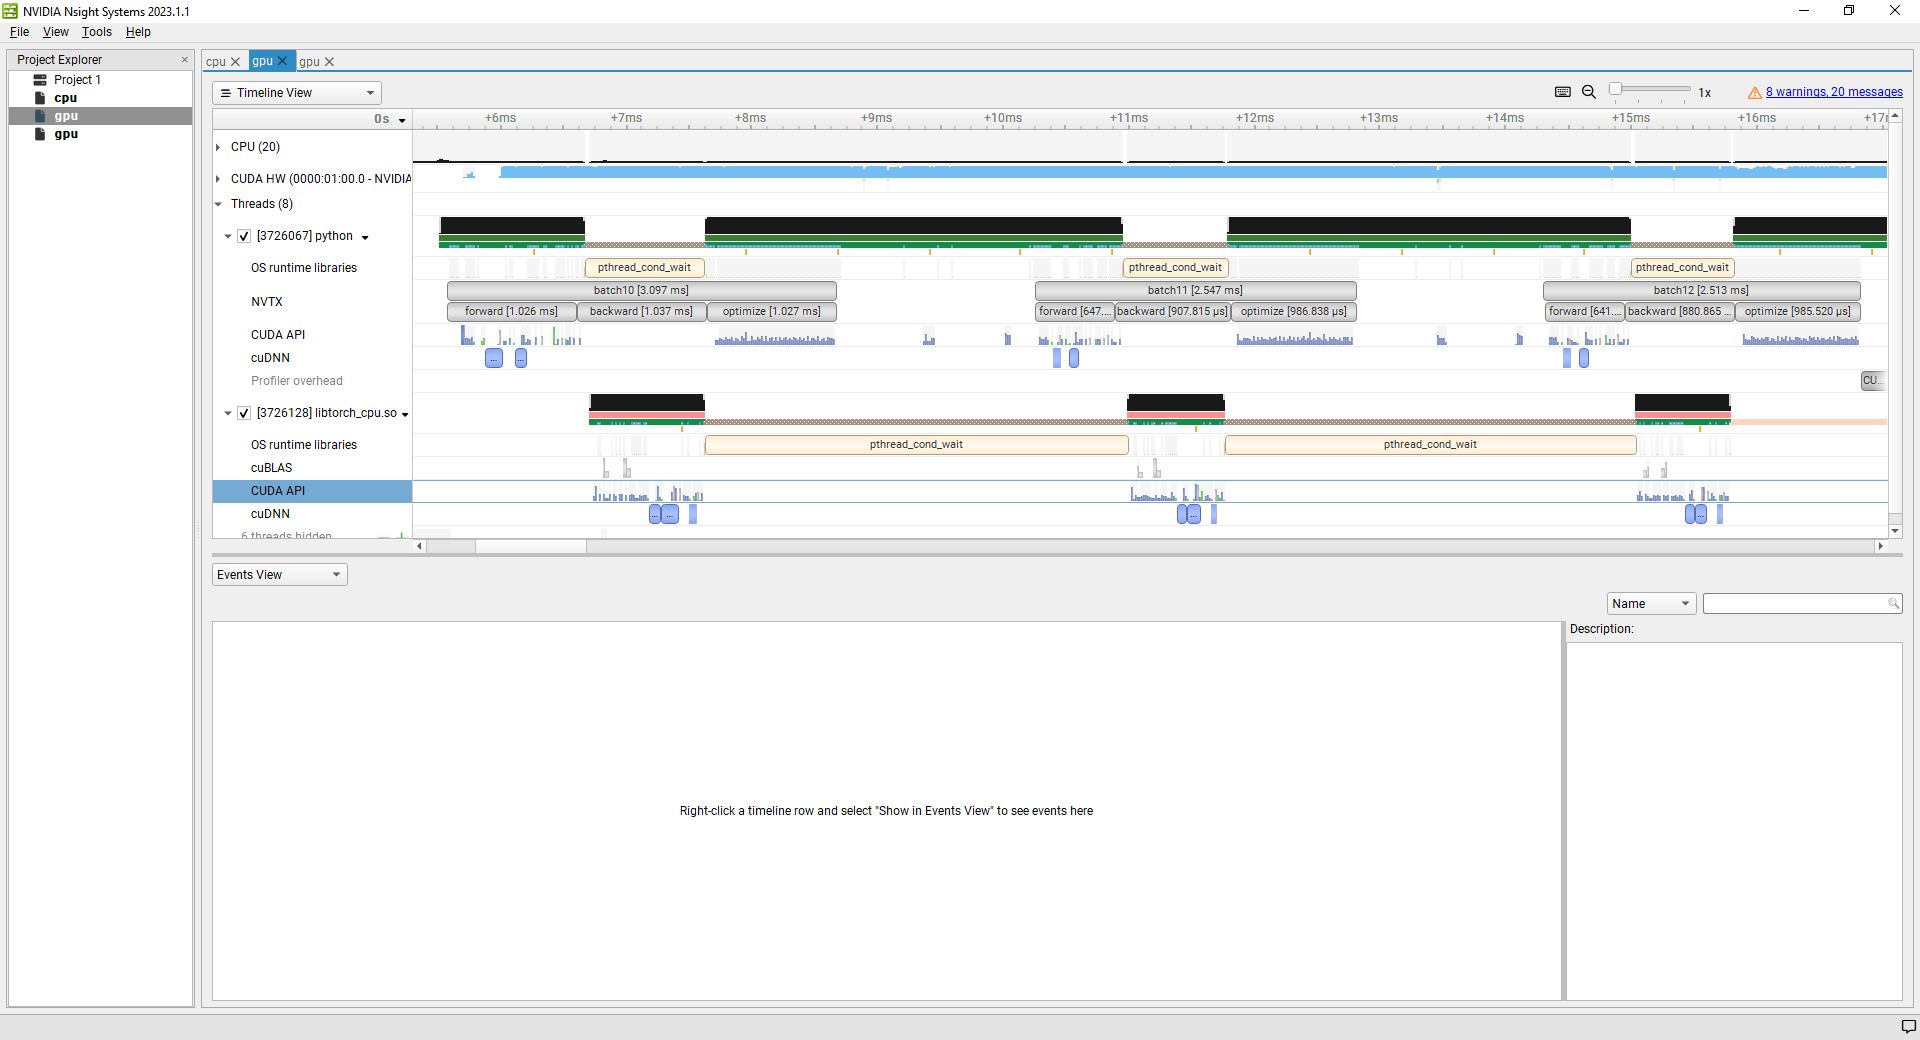
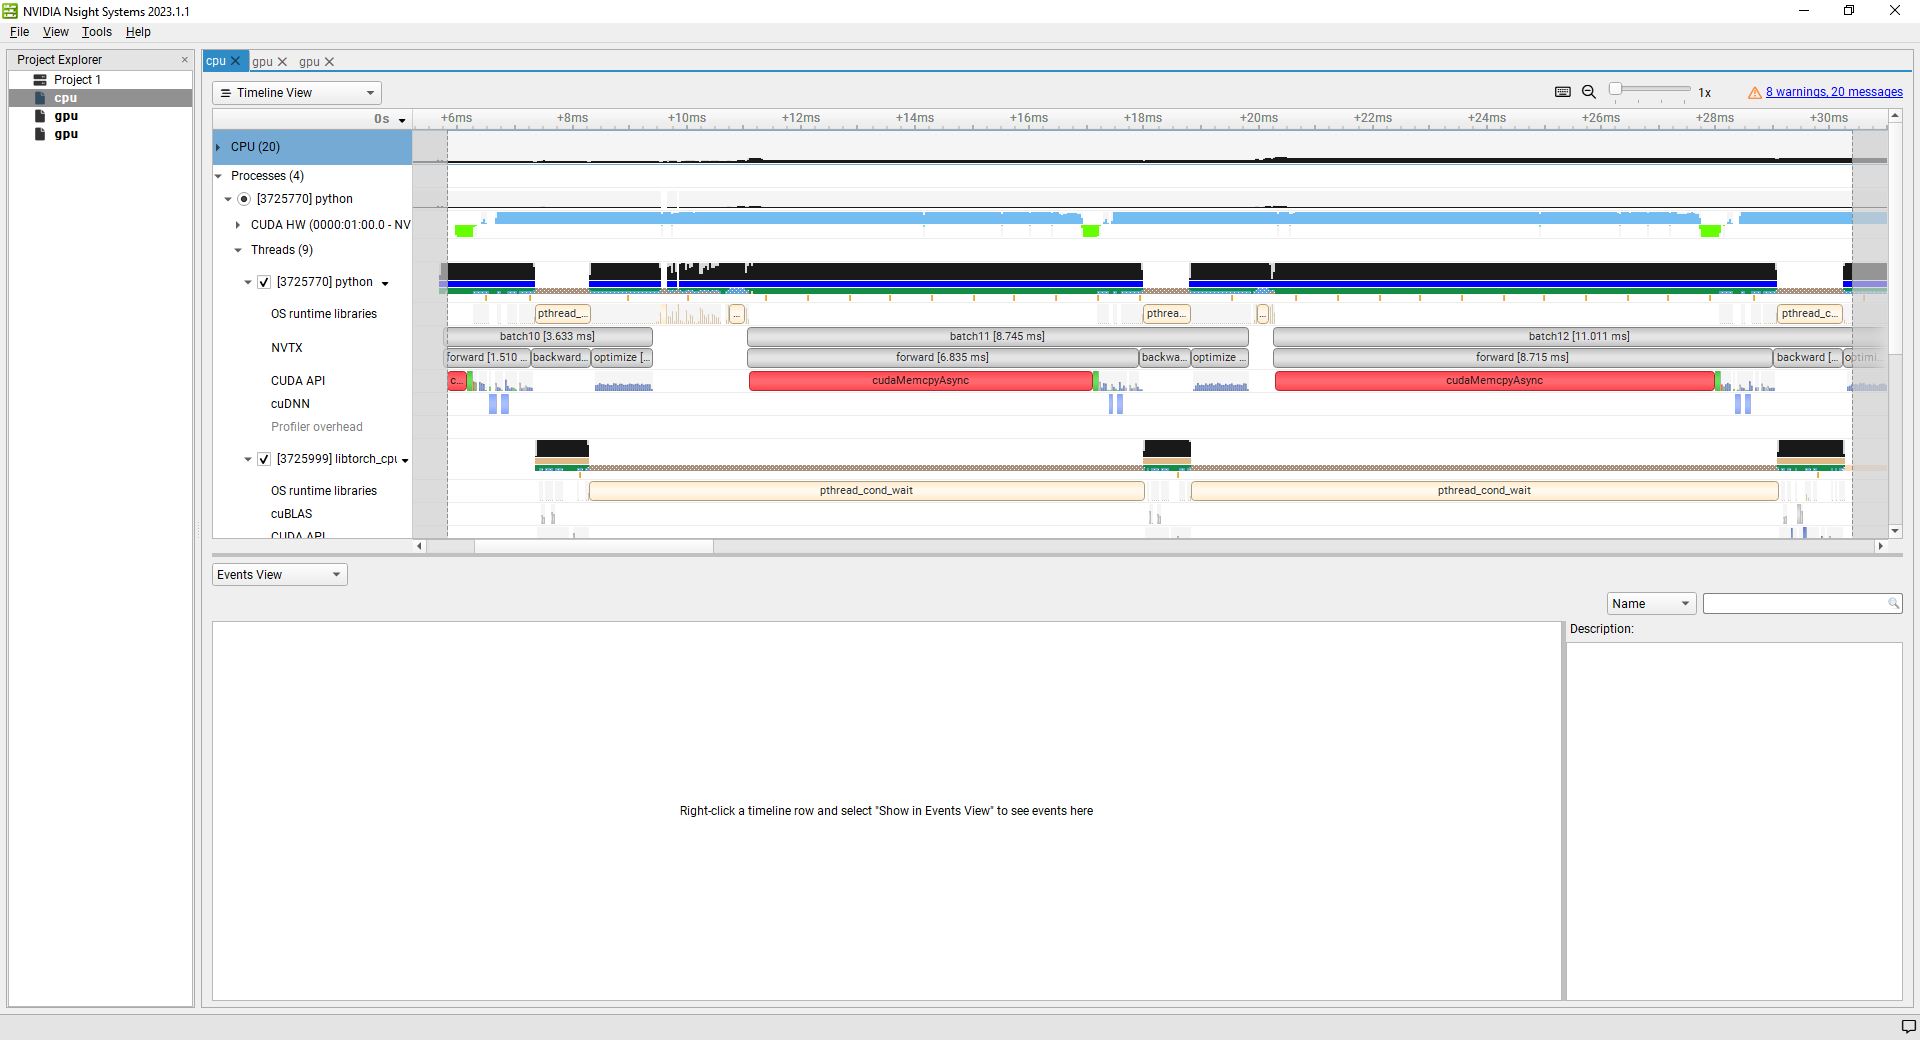
However, I am having trouble understanding the profile. I will attach the pictures below. The profile I am using is:
nsys profile -w true -t cuda,nvtx,osrt,cudnn,cublas -s cpu --force-overwrite true --capture-range=cudaProfilerApi --capture-range-end=stop --cudabacktrace=true -x true -o cpu python test.py # or gpu python test.py gpu for the gpu version

Code:

import sys
import time
import torch
import torch.nn as nn
import torch.nn.functional as F
import torch.optim as optim
from torchvision import datasets, transforms

class Net(nn.Module):
    def __init__(self):
        super(Net, self).__init__()
        self.conv1 = nn.Conv2d(1, 32, 3, 1)
        self.conv2 = nn.Conv2d(32, 64, 3, 1)
        self.dropout1 = nn.Dropout(0.25)
        self.dropout2 = nn.Dropout(0.5)
        self.fc1 = nn.Linear(9216, 128)
        self.fc2 = nn.Linear(128, 10)

    def forward(self, x):
        x = self.conv1(x)
        x = F.relu(x)
        x = self.conv2(x)
        x = F.relu(x)
        x = F.max_pool2d(x, 2)
        x = self.dropout1(x)
        x = torch.flatten(x, 1)
        x = self.fc1(x)
        x = F.relu(x)
        x = self.dropout2(x)
        x = self.fc2(x)
        output = F.log_softmax(x, dim=1)
        return output


def train(model, device, train_loader, optimizer):
    model.train()

    batch_start = 10
    batch_end = 12
    for batch_idx, (data, target) in enumerate(train_loader):

        # print a few batches
        save = batch_idx>=batch_start and batch_idx<=batch_end
        if save:
            if batch_idx==batch_start:
                torch.cuda.cudart().cudaProfilerStart()
                start = time.time()
            torch.cuda.nvtx.range_push("batch"+str(batch_idx))
            torch.cuda.nvtx.range_push("forward")

        data, target = data.to(device), target.to(device)
        optimizer.zero_grad()
        output = model(data)
        loss = F.nll_loss(output, target)

        if save:
            torch.cuda.nvtx.range_pop() #forward
            torch.cuda.nvtx.range_push("backward")

        loss.backward()
        if save:
            torch.cuda.nvtx.range_pop() #backward
            torch.cuda.nvtx.range_push("optimize")

        optimizer.step()
        if save:
            torch.cuda.nvtx.range_pop() #optimize
            torch.cuda.nvtx.range_pop() #batch
            if batch_idx==batch_end:
                print(time.time()-start,"seconds")
                torch.cuda.cudart().cudaProfilerStop()

        print('[{}/{} ({:.0f}%)]\tLoss: {:.6f}'.format(batch_idx * len(data), len(train_loader.dataset),100. * batch_idx / len(train_loader), loss.item()))


def main():
    torch.manual_seed(0)
    device = torch.device("cuda")

    transform=transforms.Compose([
        transforms.ToTensor(),
        transforms.Normalize((0.1307,), (0.3081,))
        ])
    dataset = datasets.MNIST('data', train=True, transform=transform)

    if len(sys.argv)>1 and sys.argv[1] == 'gpu':
        print("Preloading data to gpu..")
        # create a new dataset on the gpu
        # MNIST data set is format [image as Tensor, target id as int]
        gpu_dataset = []
        for x,y in dataset:
            gpu_dataset.append((x.to(device),torch.tensor(y,dtype=torch.int64,device=device)))
        dataset = gpu_dataset
        num_workers = 0
    else:
        print("Using workers for cpu...")
        num_workers = 8
    train_loader = torch.utils.data.DataLoader(dataset,batch_size=1000,num_workers=num_workers,shuffle=True)

    model = Net().to(device)
    optimizer = optim.Adadelta(model.parameters(), lr=1.0)
    train(model, device, train_loader, optimizer)

if __name__ == '__main__':
    main()

When I run this with the ‘gpu’ argument, I get the following output:

If I remove the loss.item() line, which I assume is what causes the sync back to the cpu, it seems to speed things up and clean up the graph, although I don’t know if this is just a figment of the profiler.

When I run this using the cpu transfer method, with num_workers=8, I get the following:

It seems that in all of these methods, the cpu is pegged at 100% usage. Although I suspect it is working correctly here since boosting num-workers does result in a significant speed increase. This is not the case in my main project.

I guess what I’m trying to ask is, does this profile make sense? Is the project setup correctly and is this what you would expect? Would you advice putting data on the gpu when possible, or is it better to use as many workers to make the gpu the bottleneck? I am having trouble understanding the output of nsys but I would like to follow it so that I can optimize my main project, which is clearly being bottlenecked by the cpu for some unknown reason (since it shouldn’t be doing much). Thank you!