Thanks to these two fantastic resources (I hope they help someone else), I understand how to instantiate batched Normal and MultivariateNormal objects:
https://ericmjl.github.io/blog/2019/5/29/reasoning-about-shapes-and-probability-distributions/
I also understand the output shapes of sampling the batched distributions. However, I am somewhat lost as to the input shape requirements of the log_prob method.
Here’s an example implementation that I just got right through random permutation until it worked… I still have no idea how I did it:
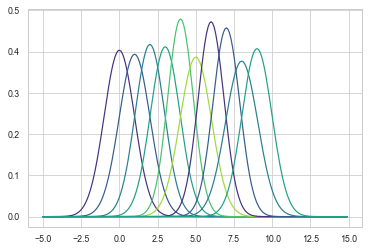
# 1D mesh. Each point on the mesh will be the mean of a different distribution
mesh = torch.arange(0, 10)

scale = torch.ones_like(mesh, dtype=torch.float32)
scale += torch.normal(mean=0, std=torch.arange(0.1, 0.2, 0.01))

x_range = torch.arange(-5, 15, 0.1)
results = torch.exp(gaussians.log_prob(x_range))

for i, res in enumerate(results.T):
    sns.lineplot(x=x_range, y=res)
Okay, so I need to unsqueeze the input and it works fine…
results = torch.exp(gaussians.log_prob(x_range.unsqueeze(1)))
The 0th dimension is the number of samples. But what is this new dimension?
And what if I have a batch of samples:
x_range = torch.arange(-5, 15, 0.1)
x_range = torch.stack([x_range, x_range + 1]) # <--- Two batches

results = torch.exp(gaussians.log_prob(x_range))

for i, res in enumerate(results.T):
    sns.lineplot(x=x_range, y=res)
Again I get
So I unsqueeze the last dimension again. Now I’m dealing with three-dimensional input and I have no idea what two of the dimension are, nor the dimensions of the output.
Here is what the docs say:

Nothing…