Hi,
I try to profile my code with the profiler module. Here the results given by the profiler :
-------------------------------------------------------  ------------  ------------  ------------  ------------  ------------  ------------  ------------  ------------  ------------  ------------
                                                   Name    Self CPU %      Self CPU   CPU total %     CPU total  CPU time avg     Self CUDA   Self CUDA %    CUDA total  CUDA time avg    # of Calls
-------------------------------------------------------  ------------  ------------  ------------  ------------  ------------  ------------  ------------  ------------  ------------  ------------
                                               aten::to         1.61%      13.661ms        18.94%     160.685ms      57.800us      11.134ms         1.23%     156.273ms      56.213us          2780
                                            aten::copy_        18.26%     154.965ms        18.26%     154.965ms     195.170us     151.355ms        16.74%     151.355ms     190.623us           794
                                Optimizer.step#SGD.step         4.55%      38.603ms        13.86%     117.564ms     117.564ms      39.414ms         4.36%     117.565ms     117.565ms             1
                                              aten::add         6.44%      54.640ms         6.44%      54.640ms      17.769us      55.985ms         6.19%      55.985ms      18.206us          3075
                                             aten::add_         6.39%      54.254ms         6.39%      54.254ms      15.404us      45.105ms         4.99%      45.105ms      12.807us          3522
                                           aten::conv2d         0.47%       3.992ms         6.21%      52.728ms     110.079us       2.794ms         0.31%      68.593ms     143.201us           479
                               CudnnConvolutionBackward         0.43%       3.682ms         6.20%      52.600ms     149.009us       1.476ms         0.16%      73.655ms     208.655us           353
                       aten::cudnn_convolution_backward         0.93%       7.918ms         5.77%      48.918ms     138.577us       3.593ms         0.40%      72.179ms     204.473us           353
                                      aten::convolution         0.46%       3.891ms         5.74%      48.736ms     101.744us       2.782ms         0.31%      65.799ms     137.368us           479
                                     aten::_convolution         0.71%       6.014ms         5.29%      44.845ms      93.622us       4.255ms         0.47%      63.018ms     131.561us           479
-------------------------------------------------------  ------------  ------------  ------------  ------------  ------------  ------------  ------------  ------------  ------------  ------------
But I only have two “.to” in my code, one for the model and the other for the inputs. Where can come from the 2000 calls ?
Here are also samples tracing from the profiler :
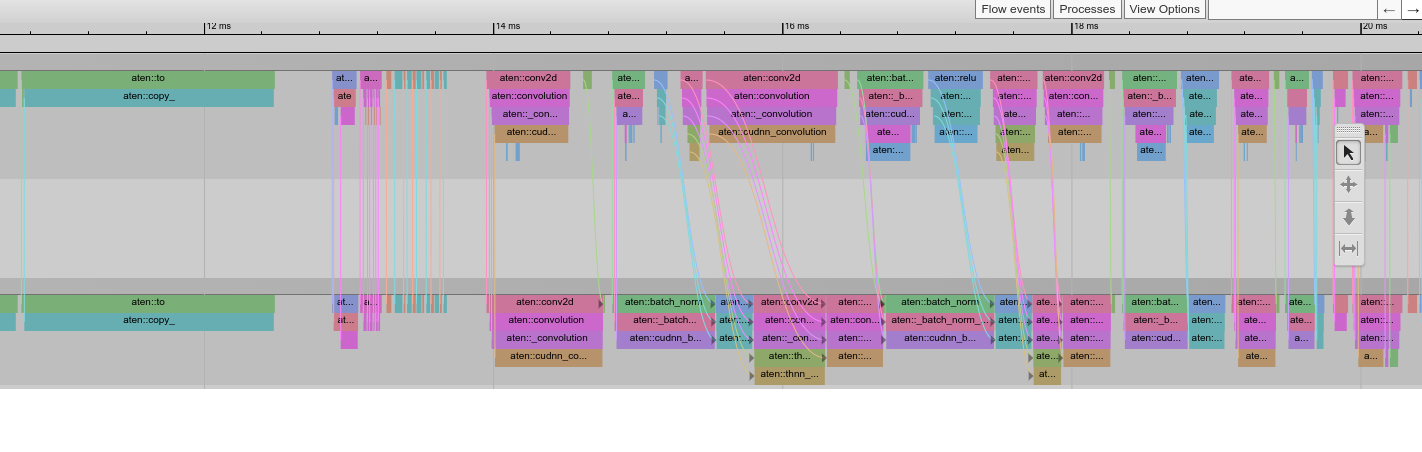
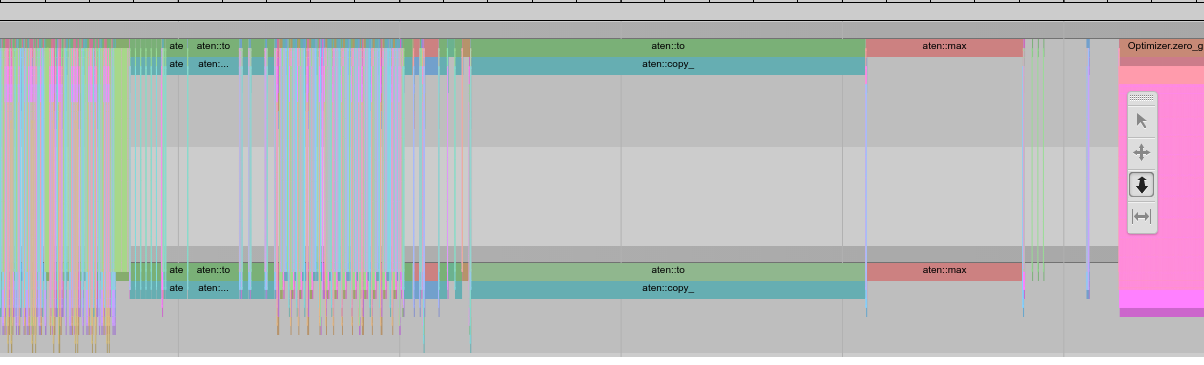
Thanks for your help