Following the examples provided in the tutorials, I’m trying to make sense of the low-pass and high-pass filters. I mean, they are very simple filters. And I wasn’t expecting to ask such questions myself, But looking at the results, it makes me wonder if I’m missing something.
The provided example filter is like this:
filter_desc: aresample=8000,highpass=f=200,lowpass=f=1000,aformat=sample_fmts=fltp
Which means only frequencies between 200Hz up to 1000Hz shall pass and the rest should be filtered out. But looking at the spectrogram:
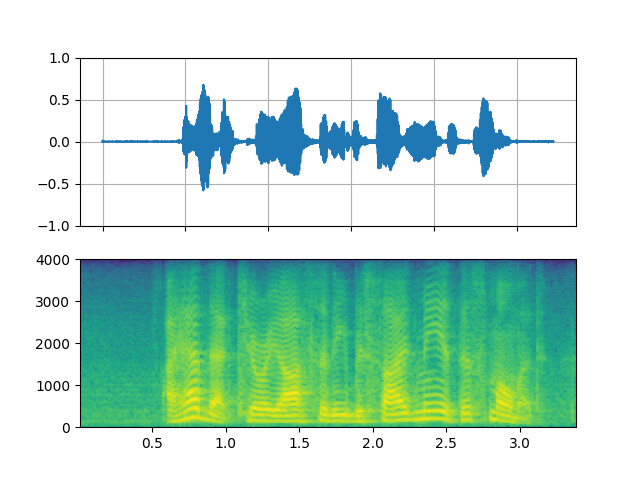
There are still information lower and 200Hz as well as above 1000Hz. What am I missing here?
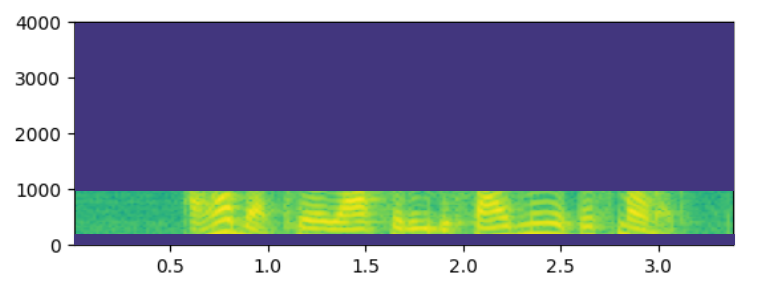
For clarification, this is what I was expecting to see: