Your desired result would correspond to an “ideal” box filter, which has a sinc impulse response in the time domain. I don’t know which filters are used in your application, but note that each one has a different response. E.g. take a look at the butterworth filter response:
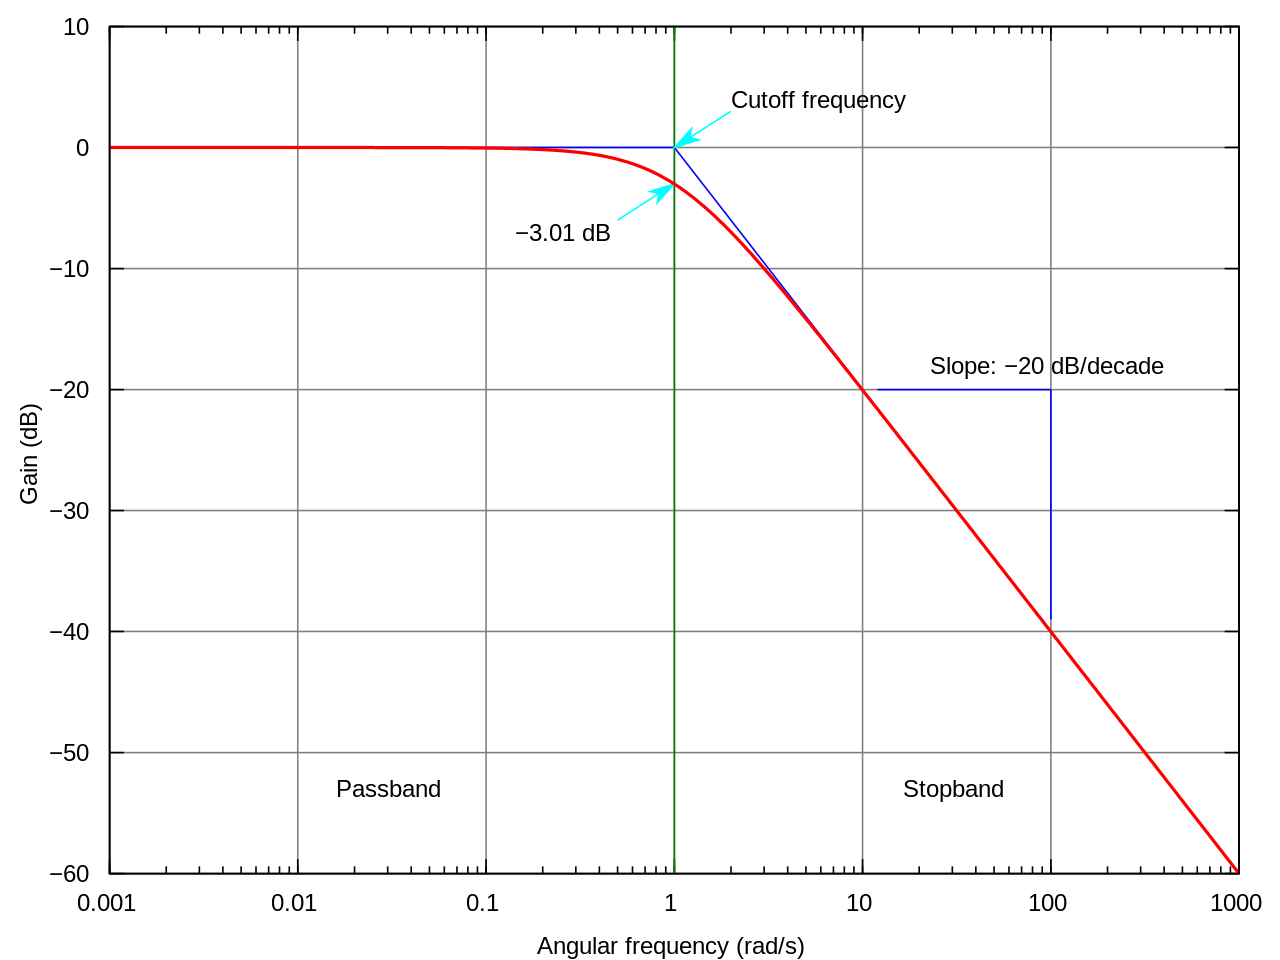
which shows the gain in dB.
I would also assume that you are plotting the power spectral density in the frequency domain and thus the values and color mapping also corresponds to a dB scale?
If so, the filtering looks reasonable.