Unexplained gaps in execution before NCCL operations when using CUDA graphs

Got a weird one here. I have a small test model that performs a mixture of matmuls and NCCL allreduces to simulate model parallel execution. (Aside: this is the same test code from the open issue at Issues · pytorch/pytorch · GitHub)

import os

import torch
import torch.distributed as dist

class Model(torch.nn.Module):
    def __init__(self, dim, nlayers):
        super().__init__()
        self.layers = torch.nn.ModuleList()
        for _ in range(nlayers):
            self.layers.append(torch.nn.Linear(dim, dim, bias=False))

    @torch.inference_mode()
    def forward(self, x):
        for layer in self.layers:
            x = layer(x)
            dist.all_reduce(x)
        return x

def main():
    os.environ["NCCL_ASYNC_ERROR_HANDLING"] = "0"
    dist.init_process_group(backend="nccl")
    rank = dist.get_rank()
    my_device = f"cuda:{rank}"
    torch.cuda.set_device(my_device)

    model = Model(2048, 12)
    model.cuda()

    g = torch.cuda.CUDAGraph()
    static_input = torch.empty((1024, 2048), dtype=torch.float32, device=my_device)
    s = torch.cuda.Stream()
    s.wait_stream(torch.cuda.current_stream())
    # Warmup
    with torch.cuda.stream(s):
        for _ in range(11):
            static_output = model(static_input)
    torch.cuda.current_stream().wait_stream(s)
    with torch.cuda.graph(g):
        static_output = model(static_input)

    torch.cuda.synchronize()
    for _ in range(10):
        g.replay()

if __name__ == "__main__":
    main()

I run this on two GPUs with torchrun --standalone --nproc_per_node=2 test.py.

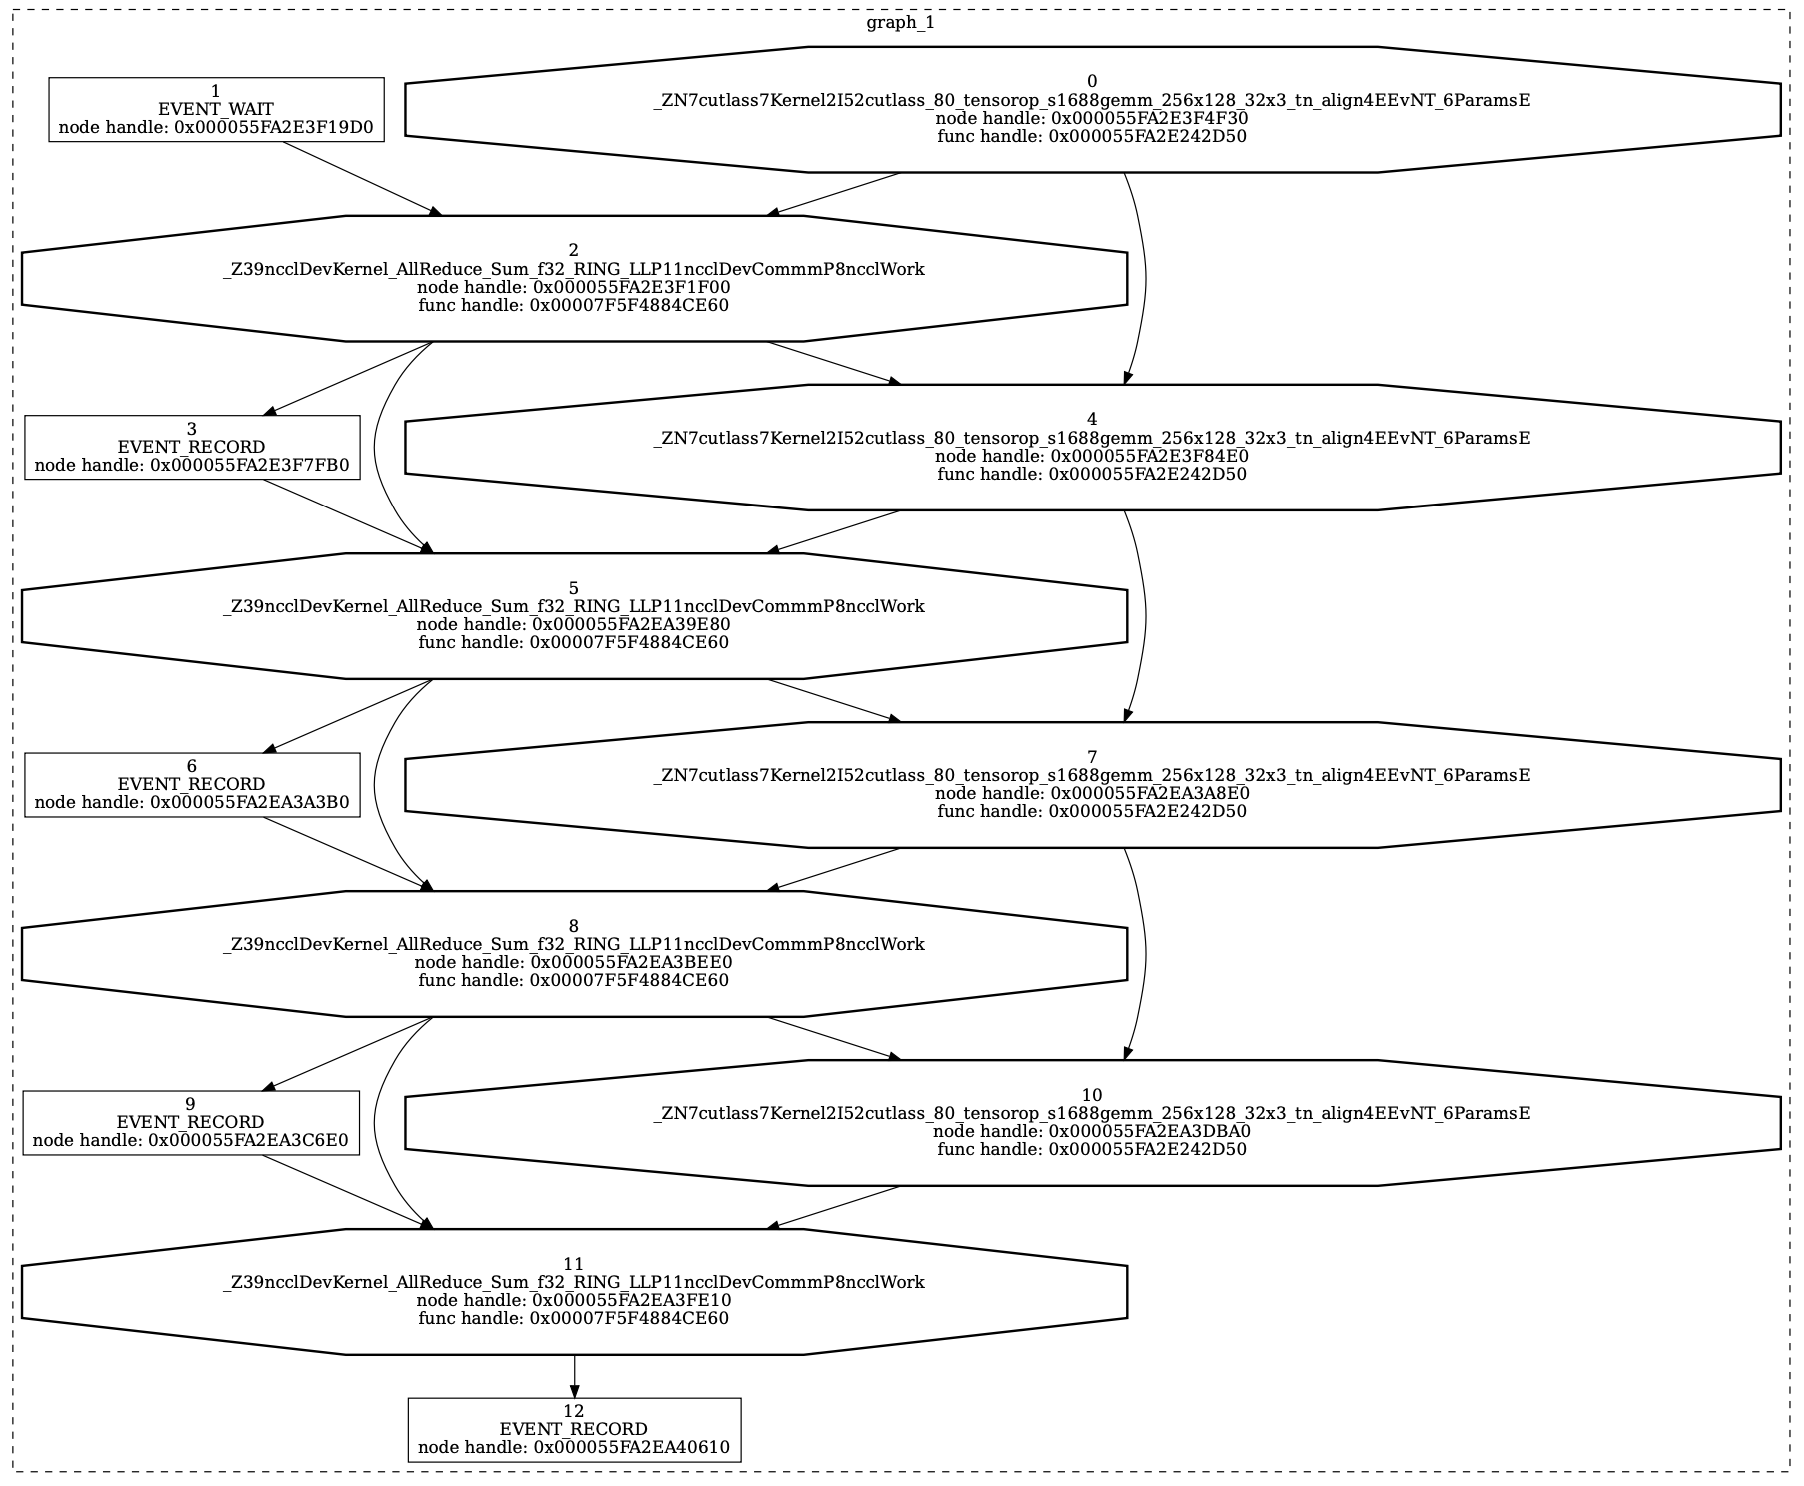
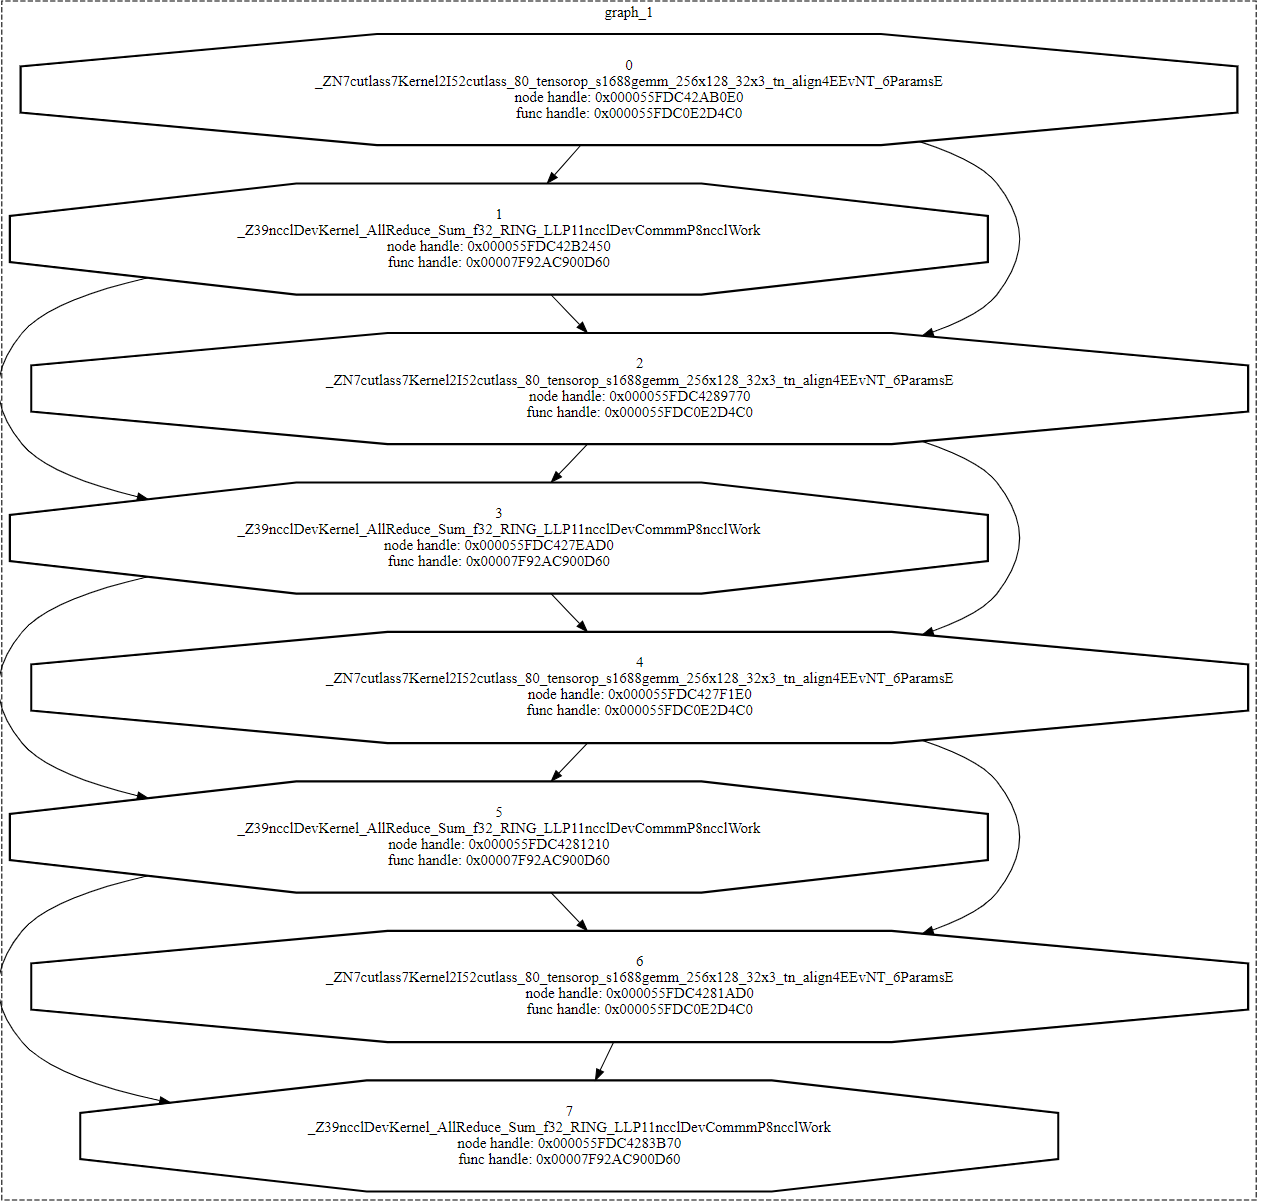
What I observe is that the graph replays are consistently longer than I would expect from just summing up matmul and allreduce times. If I generate an nsys profile, the replay region looks like this:

In terms of timing each “layer” is a sequence of:

  • matmul: 183us
  • GAP: 10us
  • allreduce: 44us

It’s that gap I am focused on – we have a production workload (using graphs and nccl) where the gap can be as high as 40us. I can’t figure out what influences the size of the gap, but it’s always present for NCCL allreduces when using CUDA graphs. For vanilla eager execution, you see exactly the profile you’d expect (1-3us between kernels based on whatever).

Looking for pointers, ideas, or anything to try – thanks!

2 Likes

Tagging @wconstab and @Elias_Ellison for distributed+graphs.

Which PyTorch version and GPUs are you using so that we could try to reproduce it?

Hey Piotr! This is on 2.1.0 (installed from the pytorch pip wheel in a container with a bunch of other stuff going on) on 2xH100s. I’ll try 2.2 (including a simpler image) and some other GPUs tomorrow to see if it reproduces for me.

Re-ran the code above on 2xA100 using the nvcr.io/nvidia/pytorch:24.01-py3 image. Same effect, though the gaps are smaller – closer to 5-8us.

Fwiw, I compared with a run with no graphs, and interestingly, I see similar gaps (a little smaller on average) – and this is despite the fact that the CPU is running very far ahead of the GPU. So I wonder if there is some critical-path work being done pre-NCCL that occurs even in the graph execution case (which I believe there shouldn’t be?).

Thank you for the follow up! We’ll try to reproduce it internally.
CC @eqy for visibility

From the above, would the expectation be that the graph replay runs slower than the ungraphed code in eager mode (e.g., 1-3us x 3 for matmul, bias, allreduce vs. 10us for the replay)?
Would we expect to see this reflected in the end-to-end times?

Hey @eqy – that’s right. I went ahead and collected some more timing data. This is running the same code as above with torch.backends.cuda.matmul.allow_tf32 = False added, since I wanted to compare with existing fp32 traces. (Looks like TF32 is now enabled by default, at least in the nvidia container image.) Let me put the raw data here, but the discussion at the bottom has the main points. (All times are on 2xH100 GPUs.)

Our Container (includes the 2.1.0+cu121 pytorch wheel)

Single kernel times (reported by nsys):

  • Matmul: 183.4us
  • Allreduce: 45.5us

E2E Time for 12 Layers (measured directly with appropriate syncs and multiple loops)

Full Model (Matmul+Allreduce) Matmul-only Model
Graphs 2.895ms 2.172ms
No Graphs 2.815ms 2.175ms
Sum of Kernels 2.75ms 2.20ms

Nvidia Container (pytorch:24.01-py3)

Single kernel times (reported by nsys):

  • Matmul: 183.5us
  • Allreduce: 51.2us (NOTE: this is a 10% slowdown from above)

E2E Time for 12 Layers (measured directly with appropriate syncs and multiple loops)

Full Model (Matmul+Allreduce) Matmul-only Model
Graphs 2.96ms 2.17ms
No Graphs 2.89ms 2.18ms
Sum of Kernels 2.82ms 2.20ms

Discussion
The main difference I am interested in is the full model time for graphs vs. no-graphs (vanilla eager execution). In both containers, you see a ~70us slowdown going from eager to graph execution. That doesn’t sound like a lot, but if you compare with sum-of-kernel-times, you see that the overhead for graph execution is ~2x compared to eager execution (ie, the gap vs. sum-of-kernels doubles).

In contrast, a model with only matmuls shows no such effects: graphs and eager execution are the same, and there is no overhead vs. sum-of-kernel-time.

As a side fact, there is a 10% regression in the allreduce time going 2.1.0 → 2.2.0, but that’s a side issue.

My last note is that in our production workload, we see that the increased overhead due to graphs is even greater than what happens here. I am still trying to figure out what causes that greater overhead.

But regardless, my expectation is that graphs should be at least as fast as eager execution – and ideally, faster, since the whole point is to eliminate the “overhead” (ie, gap between E2E time and sum-of-kernel-times.)

Thanks,
Carl

1 Like

That is interesting behavior and while there does seem to be overhead apparent to my setup (on A100) it doesn’t seem to be quite as pronounced as what you are seeing on H100. I’ll try testing on an H100 machine next.

In the meantime, I wanted to ask if you observe the same behavior when you use randn initialization for benchmarking rather than empty. I wouldn’t expect it to be related to what is going on here but we’ve observed some benchmarking weirdness due to initialization on H100 due to different power characteristics of e.g., zero vs. one init and I’m concerned a spurious NaN in the empty would pollute results or cause nondeterministic perf behavior.

Oh interesting, thanks for taking a look – I used randn to initialize for eager, so I’ll re-run graphs with randn. I also can get 2xA100s so I’ll compare that as well.

No difference on H100 with randn vs. empty initialization.

A100 numbers (24.01-py3 container, all using randn now)
Single kernel times

  • Matmul: 538us
  • Allreduce: 90us

E2E Times

Full Model Matmul-only
Graphs 7.73ms 6.45ms
No Graphs 7.66ms 6.46ms
Sum of Kernels 7.54ms 6.46ms

So: pretty similar story overall, just a baseline of everything taking longer (making overheads relatively less noticeable).

One thing I’m curious about is whether nsys is potentially affecting how results are collected? e.g., with crude torch.cuda.synchronize only timing I’m seeing:

median: 0.0011048316955566406 replay median: 0.0011022090911865234

on H100
and

median: 0.0030405521392822266 replay median: 0.002987384796142578

on A100.

My modified script:

import os                                                                                                                                                                                                                                                                                                                                                                                                                         [15/1818]
import torch
import torch.distributed as dist
import time

warmup = False
total_time = 0.0
torch.backends.cuda.matmul.allow_tf32=True
times = list()
replay_times = list()

class Model(torch.nn.Module):
    def __init__(self, dim, nlayers):
        super().__init__()
        self.layers = torch.nn.ModuleList()
        for _ in range(nlayers):
            self.layers.append(torch.nn.Linear(dim, dim, bias=False))

    @torch.inference_mode()
    def forward(self, x):
        for layer in self.layers:
            x = layer(x)
            dist.all_reduce(x)
        return x

def log(rank):
    global total_time
    global times
    if not rank:
        if total_time > 0:
            print(total_time)
            times.append(total_time)
    total_time = 0.0

def main():
    global warmup
    global total_time
    global replay_times
    os.environ["NCCL_ASYNC_ERROR_HANDLING"] = "0"
    dist.init_process_group(backend="nccl")
    rank = dist.get_rank()
    my_device = f"cuda:{rank}"
    torch.cuda.set_device(my_device)

    model = Model(2048, 12)
    model.cuda()

    g = torch.cuda.CUDAGraph()
    static_input = torch.zeros((1024, 2048), dtype=torch.float32, device=my_device)
    s = torch.cuda.Stream()
    s.wait_stream(torch.cuda.current_stream())
    torch.cuda.synchronize()
    # Warmup
    with torch.cuda.stream(s):
        for i in range(11):
            if i == 3:
                warmup = True
            if warmup:
                torch.cuda.synchronize()
                t1 = time.time()
            static_output = model(static_input)
            if warmup:
                torch.cuda.synchronize()
                t2 = time.time()
                total_time += (t2 - t1)

            log(rank)
    warmup = False
    torch.cuda.current_stream().wait_stream(s)
    with torch.cuda.graph(g):
        static_output = model(static_input)

    for _ in range(10):
        torch.cuda.synchronize()
        t1 = time.time()
        g.replay()
        torch.cuda.synchronize()
        t2 = time.time()
        if not rank:
            print("replay took:", t2 - t1)
            replay_times.append(t2 - t1)

    warmup = True
    for _ in range(11):
        if warmup:
            torch.cuda.synchronize()
            t1 = time.time()
        static_output = model(static_input)
        if warmup:
            torch.cuda.synchronize()
            t2 = time.time()
            total_time += (t2 - t1)
        log(rank)
    if not rank:
        print(f"median: {torch.median(torch.tensor(times)).item()} replay median: {torch.median(torch.tensor(replay_times)).item()}")

if __name__ == "__main__":
    main()

Ok, I’ve got something interesting. I was trying to figure out the discrepancy in our results, and the main difference is that I was timing in an outer loop like this:

torch.cuda.synchronize()
start = time.time()
for _ in range(niters)
    work()
torch.cuda.synchronize()
stop = time.time()
duration = (stop - start) / niters

wheras you are timing on a per-loop-iteration basis. This made me think that maybe the “size” of the graph matters, so I ran the following experiment (code at the bottom): vary the number of “layers” in the model and see how the eager vs. graph time compares. “Time” here means the median time where each iteration of the loop is timed separately. Results:

(This is nlayers // eager_time // graph_time // ratio)

10   2.035   2.031   0.998
20   4.051   4.098   1.012
40   8.015   8.170   1.019
80   16.125  16.407  1.017
160  31.993  32.730  1.023
320  64.254  65.975  1.027
640  129.808 133.426 1.028
1280 259.163 267.940 1.034

The pattern is clear: as the amount of work you are submitting to the GPU grows, the graph overhead (in the presence of NCCL) grows with it. Notably, given my results above, it’s not only about the size of the graph of work. You can get the same effect by submitting a small graph many times – I was submitting a 12-layer model for 100 loop iterations to get my original time measurements.

@ptrblck – there are elements of this that ring some architectural bells for me, maybe need to discuss offline.

Code for above:

import os
import statistics
import sys
import time

import torch
import torch.distributed as dist

class Model(torch.nn.Module):
    def __init__(self, dim, nlayers):
        super().__init__()
        self.layers = torch.nn.ModuleList()
        for _ in range(nlayers):
            self.layers.append(torch.nn.Linear(dim, dim, bias=False))

    @torch.inference_mode()
    def forward(self, x):
        for layer in self.layers:
            x = layer(x)
            dist.all_reduce(x)
        return x

def main():
    assert len(sys.argv) > 1
    nlayers = int(sys.argv[1])
    batch = 1024
    hidden = 2048
    niters = 50

    torch.backends.cuda.matmul.allow_tf32 = True
    os.environ["NCCL_ASYNC_ERROR_HANDLING"] = "0"
    dist.init_process_group(backend="nccl")
    rank = dist.get_rank()
    my_device = f"cuda:{rank}"
    torch.cuda.set_device(my_device)

    model = Model(hidden, nlayers)
    model.cuda()

    x = torch.randn((batch, hidden), dtype=torch.float32, device=my_device)
    for _ in range(11):
        model(x)

    torch.cuda.synchronize()
    times = []
    for _ in range(niters):
        torch.cuda.synchronize()
        tic = time.time()
        model(x)
        torch.cuda.synchronize()
        toc = time.time()
        times.append((toc -  tic)*1000.)
    torch.cuda.synchronize()
    eager_time = statistics.median(times)

    g = torch.cuda.CUDAGraph()
    static_input = torch.randn((batch, hidden), dtype=torch.float32, device=my_device)
    s = torch.cuda.Stream()
    s.wait_stream(torch.cuda.current_stream())
    # Warmup
    with torch.cuda.stream(s):
        for _ in range(11):
            static_output = model(static_input)
    torch.cuda.current_stream().wait_stream(s)
    with torch.cuda.graph(g):
        static_output = model(static_input)

    torch.cuda.synchronize()
    times = []
    for _ in range(niters):
        torch.cuda.synchronize()
        tic = time.time()
        g.replay()
        torch.cuda.synchronize()
        toc = time.time()
        times.append((toc - tic)*1000.)
    torch.cuda.synchronize()
    graph_time = statistics.median(times)
    if rank == 0:
        print(f"{nlayers} {eager_time:.3f} {graph_time:.3f} {graph_time/eager_time:.3f}")

if __name__ == "__main__":
    main()

Outer shell script:

#!/bin/bash

for nlayers in 10 20 40 80 160 320 640 1280; do
  torchrun --standalone --nproc_per_node 2 test.py $nlayers >> results.txt
done

Here’s a dumb question: is there any way at all to convince PyTorch to put NCCL work in the same stream as everything else as opposed to using a side stream and extra event syncs? I logged out the captured graph (this is just 4 layers) and it looks like this:

Not exactly sure what the EVENT_RECORD nodes are doing, but I wonder if things would be better if the graph was just a single linked-list of alternating gemm/allreduce.

Thanks for digging into the benchmarking and that is very interesting indeed…

I’m wondering if the event records are actually from NCCL or PyTorch’s usage of NCCL. Does setting TORCH_NCCL_AVOID_RECORD_STREAMS=1 change the behavior for you? It doesn’t seem to really affect the benchmarking results on my end.

EDIT: dumped the graph on my end as well and looks like the event record nodes are still there so I suspect it’s something NCCL is doing rather than PyTorch

@cbcase I checked with some CUDA Graphs folks and they confirmed that this behavior is expected of NCCL in order to support concurrent multi-graph replay. In this case it isn’t needed and NCCL_GRAPH_MIXING_SUPPORT=0 can be used to turn it off. On my end I see this causes the slowdown relative to eager mode to go away.
The eventRecords are also gone in the dumped graph:

1 Like

Wow, that’s it – thanks for bugging the NV folks, @eqy. Truly there is always an environment variable for it.

Two things I observe with this env var set:

  • In the microbenchmark, the graph version becomes substantially faster than eager (~5%), rather than slower and large model sizes.
  • In our relevant production inference workload, this env var is a very large E2E speedup. (In the sense of moving some parallelism techniques from not viable to useful.)

Last question: should I open a github issue? Ideally others trying to (eg) use pytorch for production inference with cuda graphs won’t need to stumble on this thread to fix NCCL overheads. The docs for that env var are pretty obtuse, but I think PyTorch already is making an effort to avoid the thing it describes.

Sure feel free to open a github issue as it also sounded like the graphs and driver teams also didn’t have a great explanation of why the eventRecord/Wait would be more expensive in a graph capture than in vanilla eager mode and it might be something worth tracking.