I’m trying to train a ResNet50 for ImageNet dataset, but observed a fluctuation of GPU utilization between 32% and 89% (measured via nvidia-smi). I’m using the provided network at this point:
model = torchvision.models.resnet50(pretrained=True)
model.type(torch.cuda.FloatTensor)
However, when I switched to VGG network, I got >96% GPU utilization. I’m wondering, is the fluctuated GPU utilization normal for ResNet? If so, why does it happen?
The fluctuating GPU util. might indicate e.g. a data loading bottleneck and would depend on the actual workload.
I.e. if the ResNet training on the GPU is faster than VGG, the data loading bottleneck would be more visible (since the GPU would wait longer for the next batch) so you might want to profile your code to isolate where the bottleneck is coming from.
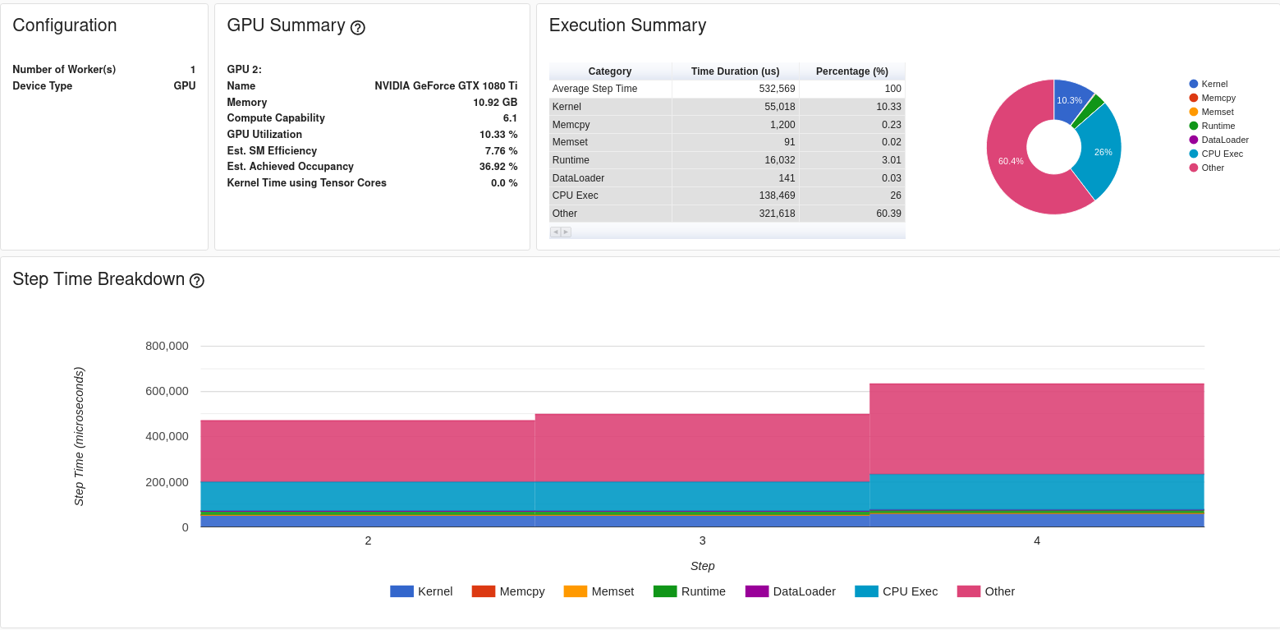
Thanks for the reply. After profiling my code, I don’t think data loading is the bottleneck (see below). I’m actually confused by the summary report. It seems there’s a category called Other that dominates GPU and CPU executions. I’m wondering, what does this category mean? The convolution layers are customized, does this relate to the Other category?
Also, for curiosity, what does the Runtime category correspond to?
I implemented my own version of convolution rather than calling nn.Conv2d. Even though, should these operations be part of CPU or GPU executions? Why are they categorized as Other?
I don’t know where “Other” is coming from, as I’m usually using Nsight Systems to profile GPU workloads.
You could profile your custom implementation in isolation and check how good the util. is.
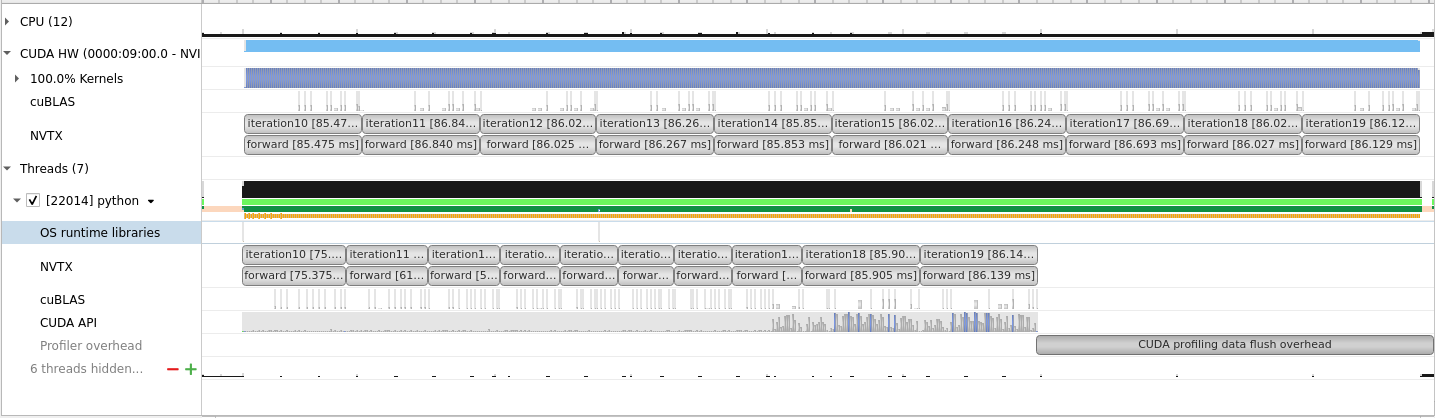
I only profiled forward path. Does it look normal? As I’m not familiar with this tool, it would be great if I could get your feedback.
In addition, I noticed that in your post, you have a row called cuDNN, which doesn’t exist in my case. But I’m pretty sure I included cudnn with –trace option. I’m wondering how you made it and if it’s the reason that slows down my training? Thanks!
Are you profiling your custom implementation? If so, I would guess you are not calling into cuDNN but are using maybe cublas? You could check the kernel section to see which kernels are executed etc. to see which part of your implementation needs how long.
Generally, this presentation or this repository could be helpful in getting familiar with the profiling tools.