I have found some very unusual behavior when comparing time of inference run for ResNet50 in image classifier for various backends. I’d very much appreciate any comment why such thing might have happened.
Where <testImages> is directory with 1/16/32/64 images depending on the tested batch size. To have a bit clearer picture I have used measured time to calculate images/second value.
And now the strange part…
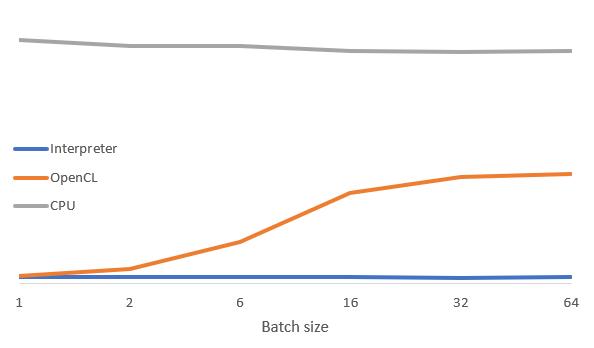
For OCL I can see logarithmic increase, but for all other backends value is constant. It completely doesn’t matter how big batch size I throw at it, images/second value is the same (+/- small noise).
On generated dot file everything looks reasonable, that is batch size is propagated.
Have you also experienced similar behavior? Or maybe I’m just doing my measurements wrong?
Hi Sebastian, I’m assuming this is because the OpenCL backend takes advantage of parallelism across the multiple images in the batch, whereas our CPU and Interpreter do not and are always running on a single CPU core. So I would expect to always see about the same images/second for the CPU and Interpreter, whereas the OpenCL backend will benefit from this parallelism up until whatever device you’re using has all of its parallel resources exhausted, at which point images/second would plateau. This appears to be what you are seeing here.